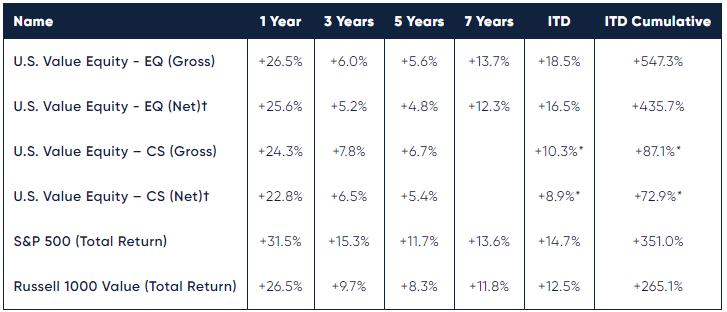
*Partial period shown beginning August 1, 2013. †Net returns methodology is detailed at end of letter.
Lyrical began managing capital for clients in 2009, making 2019 our 11th year in business. Our first nine years were gratifying. We achieved net returns of +440%, 181 percentage points better than the S&P 500 and 225 percentage points more than the Russell 1000 Value. Our results ranked at the top of our peer group and helped us grow from one client account of $5mm to a firm managing billions.
The last two years have been challenging from a performance perspective. Rather than being in the first percentile, we have been closer to the 99th. Even so, our 11-year performance record ranks us in the top 1% of our peer group.
As we enter 2020, we believe the challenging times are likely behind us. While we experienced some of our worst monthly returns in 2019, we experienced a sharp recovery starting in late August which erased most of our underperformance for the year.
The portfolio today has a historically wide discount to the market, and we believe we are poised to deliver the kind of outperformance that has made us a top percentile manager.
We thank our investors for their past and present confidence in us. We appreciate your patience and understanding throughout this challenging period and look forward to the period ahead.
A TALE OF TWO MARKETS
The story of 2019 was a tale of two markets. In the first eight months of the year, our stocks underperformed. Then at the end of August there was a significant turn, and in the final four months our stocks rallied more than 20% and outperformed the S&P 500 by 800-900bp.

*Please refer to Notes for important details re data presented herein
VALUE'S DOWNCYCLE
We believe the sudden shift in our performance at the end of August is likely a sign of the value cycle turning. In 2018, a downcycle of relative performance began for deep value stocks. Prior to 2018 deep value stocks were doing fine. They significantly outperformed the S&P 500 from 2009 to 2013, and more recently had modestly outperformed from 2016 to 2017. But something changed for deep value stocks as the calendar flipped from 2017 to 2018. In all but two months of 2018, deep value stocks underperformed. This persistent underperformance is visible in the chart below which shows the relative performance of our deep value proxy – the bottom quintile of our universe as ranked by forward P/E.
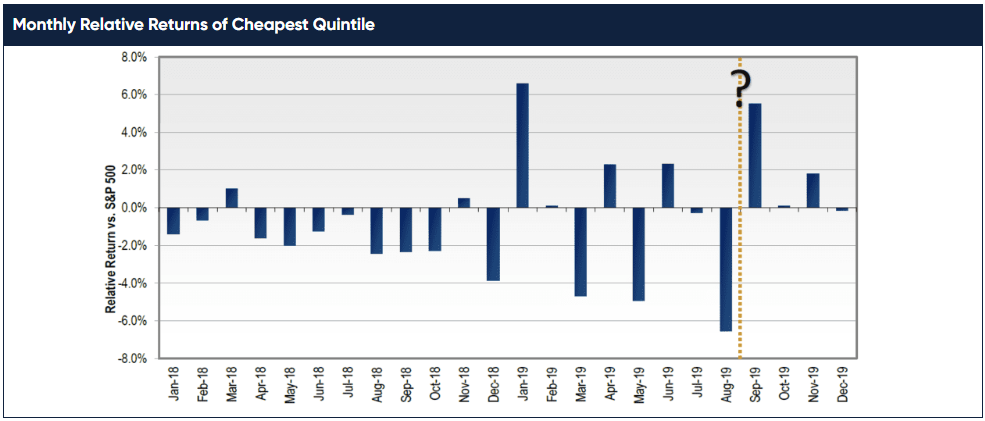
In 2019, deep value underperformance continued but with much more volatility. Deep value stocks had some very good months, but they were offset by worse months soon after. January was a great month but was offset by March. Then April was good, but May was terrible. June was good again, but August was the worst month of this entire period.
As bad as August looks on this chart, it was actually worse a few days before month end. But then, starting on August 28th, deep value stocks began to outperform significantly. The positive performance from the last days of August continued into September, which turned into a very strong month for deep value stocks. Since September, deep value stocks have continued to outperform, without any significant offsetting months.
We have reason to believe that August ended the 20-month downcycle for deep value. We saw a pattern emerge in 2019 that has been seen at the end of the last four value cycles going back 40 years. First, prior upcycles have started with a bang not a whimper, meaning a month of significant outperformance, as we saw in September. Second, prior cycles were darkest before the dawn, with the worst months of underperformance at the end of the downcycle, which we saw in August. Last, the timing was right for this to be the turn in the cycle. The average duration of prior downcycles is 20 months, and as of August this cycle had lasted 20 months.
In fairness, this is educated guesswork. We were hopeful that January 2019 was the start of the upcycle. It fit the same pattern that we saw in September except that the timing was short at 12 months, not 20. As it turned out, January was not the turn we hoped for. We cannot be sure September is the turn either, but we become more and more confident with each passing month.
IT AIN'T THE FUNDAMENTALS
What changed on August 28th? We are the first to admit we do not know the answer. Our best guess is that value stocks did not deserve to underperform in the first place.
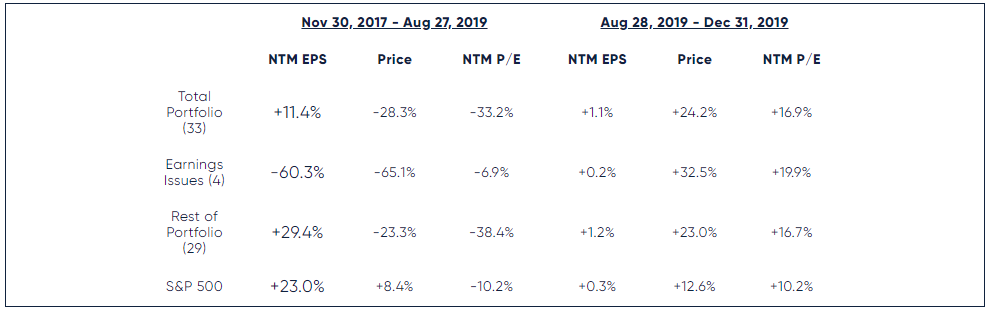
The evidence shows that value stock performance was not related to fundamentals. To demonstrate this point, we have analyzed the change in earnings expectations for our portfolio stocks, looking at two time periods. One period is the 21 months from November 30, 2017 to the bottom on August 27, 2019. The other period is the four months from the August 27th bottom until the end of the year. The contrast between fundamental earnings performance and stock price performance is striking.
During the 21-months of our underperformance, the average earnings expectation for our current portfolio grew by 11.4%. The market rewarded this double-digit increase with an average stock price decline of 28.3%, at the same time the S&P 500 price increased by 8.4%, a difference of 36.7 percentage points.
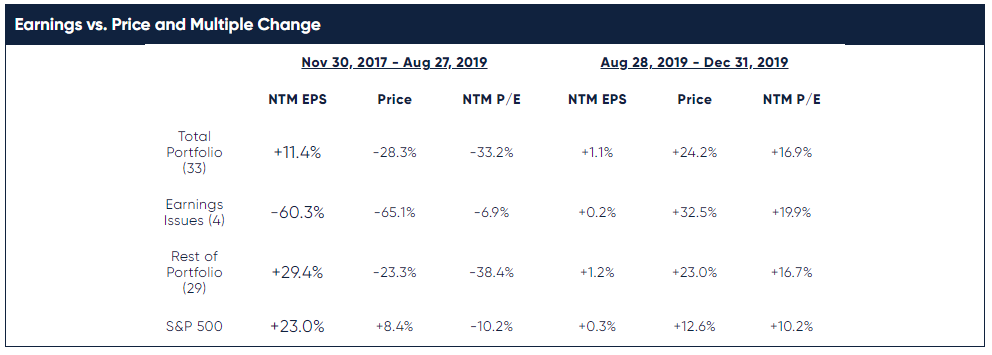
The numbers are more striking when we exclude the four stocks that experienced significant earnings issues. The remaining 29 stocks make up 88% of our names and >90% of our composite capital. On average these stocks experienced a 29.4% increase in earnings estimates, more than six percentage points better than the 23.0% experienced by the S&P 500. Despite greater increases in earnings estimates, these stocks were down 23.3%, more than 31 percentage points worse than the S&P 500. As a result of earnings estimates growing faster, and the stocks underperforming, the average P/E of our portfolio fell to just 8.6x, while the S&P 500 was at 16.8x, a whopping 98% premium.
Since August 28th our stocks are acting more favorably. All but two of our stocks are up since then, and the average stock price is up 24.2%, more than 11 percentage points better than the 12.6% S&P 500 price change. Notably, the four stocks with significant earnings issues are up 32.5% on average, 20 percentage points better than the S&P 500. This improved stock performance is happening without any material change in fundamentals. Earnings expectations for our companies are up only 1.1% on average over this time.
For 21 months our stocks underperformed, not because of fundamentals but because value stocks fell out of favor. We have seen this behavior before during the financial crisis and the tech bubble. After prior value down cycles we have seen that value stocks can come back into favor as suddenly as they fall out. Even if we are wrong about the timing of the value cycle, we believe strong fundamentals and low valuation should still lead to lucrative returns over time from here.
VALUE INDICES MAY NOT PERFORM EVEN IF VALUE STOCKS DO
If value stocks are making a comeback, it still may not lead to outperformance of the value indices and the ETFs that track them. For over 20 years, value indices have underperformed even as deep value stocks, as we define them, have massively outperformed. Let us explain.
There is a significant distinction between what we call Index Value and Deep Value. Index Value refers to the major value benchmarks from Russell, S&P and MSCI. Deep Value refers to the cheapest stocks in the market and is the kind of value investing we practice at Lyrical. Index Value and Deep Value may sound like the same thing, many assume they are the same thing, but they most definitely are not the same thing.
The answer lies in the way these indices are constructed. Our proxy for deep value is constructed from the Low P/E Quintile. We start with the 1,000 largest U.S. stocks and sort by forward P/E. The bottom quintile, the cheapest 200, are equal-weighted. The resulting portfolio has very little overlap (i.e. passive share) with the S&P 500, just 12%. We have performance data for these stocks going back 22 years to 1998. Over that period, these deep value stocks have appreciated 957%, 552 percentage points more than the 404% of the S&P 500.
*As of December 31, 2019.
Russell starts its construction with a very similar universe of 1,000 of the largest U.S. equities. Russell uses both value and growth metrics to give each stock a value and growth score, and then allocates each stock to the value or growth index or splits them and puts them in both. More than 300 stocks are currently split and allocated to both value and growth indices. Their style indices are constructed so that half the universe market cap is in each. The result is that there are 766 stocks currently in the Russell Value Index, or 77% of the stocks in the Russell 1000. This clearly is not an index that focuses on owning the cheapest stocks. Rather it is an index that owns everything except the most expensive stocks.
Russell also capitalization weights these stocks. This leads to a portfolio that has 54% overlap with the S&P 500. It also leads to a portfolio that has not enjoyed the outstanding returns of deep value stocks. Instead of outperforming the S&P 500 by hundreds of percentage points, the Russell Value Index has underperformed by 21 percentage points.
S&P has their own value index, but with 395 constituents it includes 79% of the S&P 500. It is also cap weighted and has an even higher overlap with the S&P 500. Like the Russell 1000 Value, the S&P 500 Value index has underperformed, trailing the S&P 500 by 63 percentage points over this 22-year period.
Warren Buffet became one of the richest men in the world pursuing a value investing strategy. No one has given value investing a better name than Warren Buffet. Conversely, it seems no one has given value investing a worse name than the large cap value indices.
NOT MUCH VALUE IN THE VALUE INDEX
One of the problems with index value is that very little of the index is composed of stocks from the cheapest quintile. When you sort our universe into valuation quintiles, the stocks with the lowest P/Es have had the highest returns, as shown by the blue bars in the chart below on the right. Since 1998, the cheapest P/E quintile has produced an annualized return of 11.3%. The second cheapest quintile did well, but not as well. It returned 10.0%, 1.3 percentage points worse than the cheapest quintile. Expensive stocks did even worse than that, with annualized returns 1.9 and 6.3 percentage points worse than the cheapest stocks. The yellow bars show that between our universe and the Russell 1000 Value universe each quintile has similar returns. Thus, the cheap stocks in the Russell Value universe performed about as well as our deep value proxy.
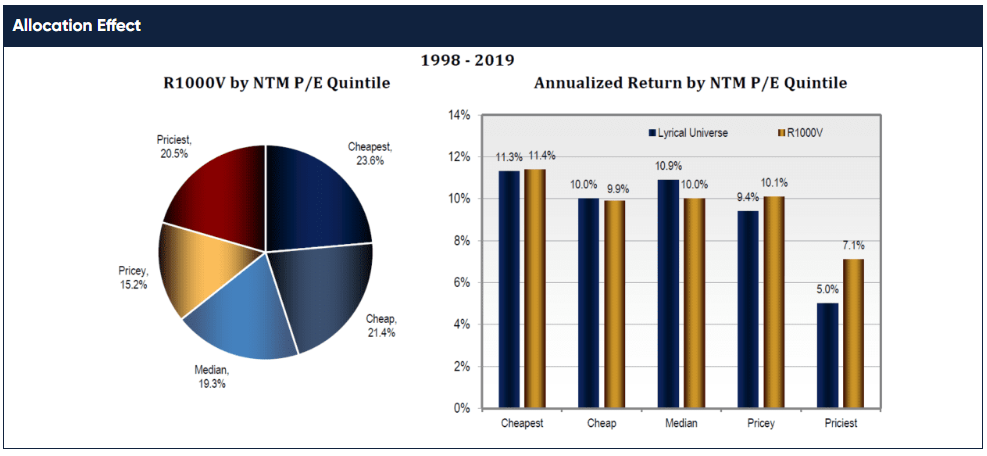
The problem with the Russell 1000 Value is that there is not a lot of value in it. As the pie chart above on the left shows, only 24% of the stocks came from that best performing cheapest quintile. The index itself is mostly composed of pricier stocks with lower returns. By our calculation, the total allocation effect has lowered the index returns by 1.6 percentage points per annum.
CAPITALIZATION WEIGHTING HURTS, TOO
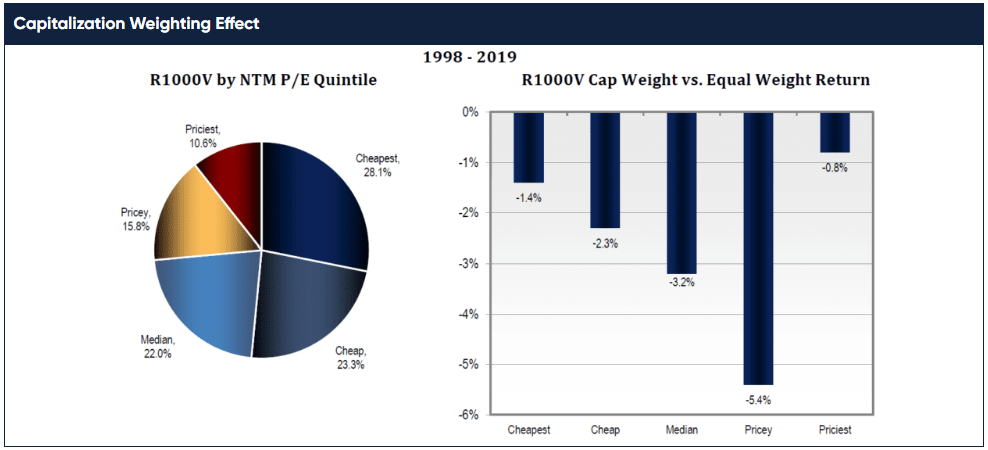
The other problem with Index Value is cap weighting. The good news is that cap weighting increases the exposure to the cheapest quintile. While 24% of the stocks are in the cheapest quintile, 28% of the capital is in the cheapest quintile with cap weighting, as shown in the pie chart below on the left.
Source: FactSet; Lyrical analytics
The bad news is that cap weighting lowers the annualized returns for every quintile. By our calculation, the cap weighting effect lowered the index return 2.3 percentage points per annum.
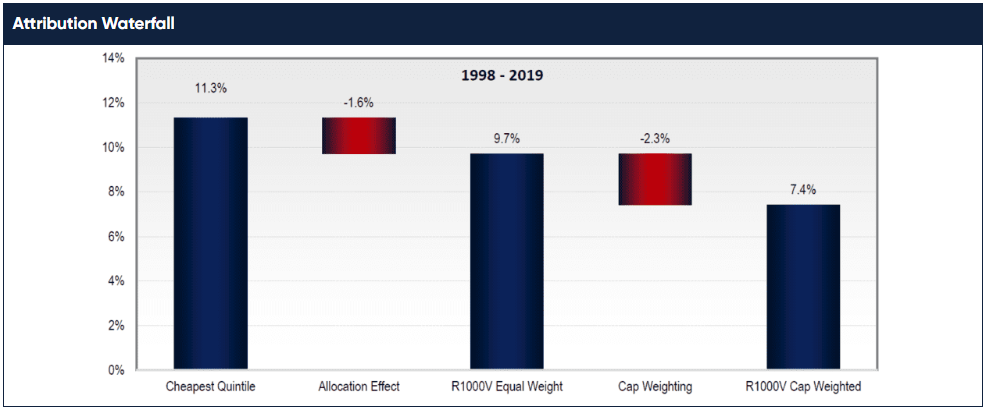
In summary, the chart below provides a waterfall from the 11.3% annualized return of our deep value proxy, the cheapest P/E quintile, to the 7.4% return of the Russell 1000 Value index. Note that the S&P Value and MSCI Value indices fared even worse, with annualized returns of 7.0% and 6.7%, respectively.
PASSIVE IS OK, JUST NOT FOR VALUE
We believe we have entered a new upcycle for value stocks, but investors need to be selective about how they get their value exposure. Passive investing and ETFs have grown tremendously over the last decade. Unfortunately for investors, these ETFs provide Index Value, not Deep Value. We looked at the top 100 ETFs and only three are large cap value. One tracks Russell 1000 Value, another the S&P 500 Value and the third tracks the MSCI Value. Beyond the top 100 ETFs, we looked specifically at more than 30 of the largest ETFs in the Large Cap Value category. Many on this list aren’t actual value strategies, but dividend strategies. None in the category track anything like the lowest P/E quintile. These ETFs are not that cheap either, with an average expense ratio of 35 basis points.
The issue of Index Value versus Deep Value applies to active large cap value managers, too, as many active funds are managed to track value indices. Some investors are sensitive to tracking error, and if low tracking error is your goal, these funds can provide that. Our goal at Lyrical is not to minimize tracking error but to maximize our long-term returns. Given the poor performance of value indices over the last 20 years, for us the real tracking error is the error of tracking these large cap value indices.
LOOKING FORWARD
For five years from 2013 to 2017 our portfolio P/E ratio hovered around 12x. In 2018, our stock prices fell even as earning rose, and the portfolio multiple compressed to just 8.5x, a level comparable to what it had been at the end of the financial crisis and during the European debt crisis. In 2019 stock prices rebounded strongly, and while the portfolio P/E expanded to 9.6x, it remains 23% below year end 2017 levels and quite low by historical standards. On the other hand, the S&P 500 forward P/E ratio is back to its year end 2017 levels, and at 18.3x is at a post-crisis high and well above its historical average.
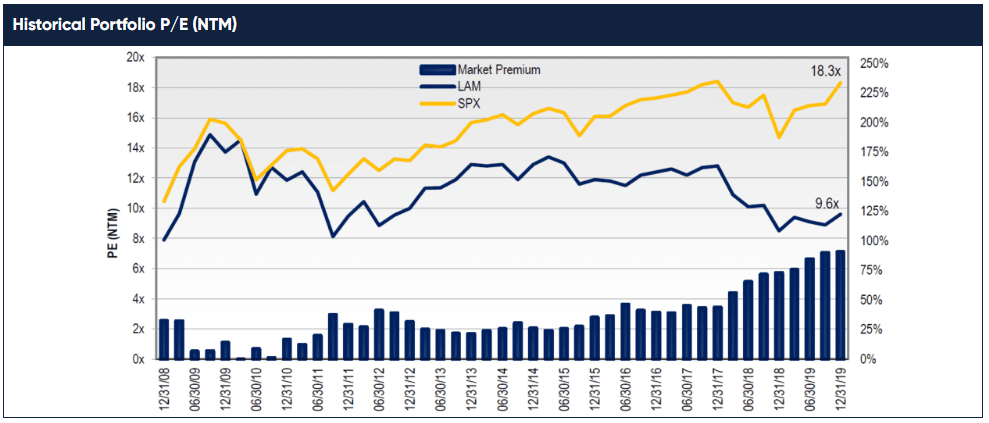
Prior to 2018, the S&P 500 has had an average P/E premium to our portfolio of ~27%. In 2018, as deep value stocks entered a downcycle our valuation spread almost tripled to 73%. In 2019, with additional underperformance and the addition of new low P/E stocks to the portfolio, the spread widened further to 91%, by far the widest spread in our firm history.
We believe valuation spread is one of the best measures of our outperformance potential, and by that measure, there has never been a better time to be invested with Lyrical than now.
CONCLUSION
Starting in 2018 a great divergence began within the U.S. equity market. Not only did cheap stocks experience multiple compression and become cheaper, but pricey stocks experienced multiple expansion and became pricier. The latter has been more obvious as the S&P 500 makes record highs and its multiple expands to post-crisis highs.
Divergences like this have happened periodically in the market, roughly once a decade. We observed the same thing last decade during the financial crisis, and the decade before during the tech bubble. We have a name for these divergences. We call them value cycles, and we believe the current value cycle is responsible for our underperformance in 2018 and part of 2019.
At the end of August, our performance flipped from bad to great. We think we have seen the bottom of this value cycle, but it is difficult to know for sure in real time.
Value cycle or not, we believe our portfolio is incredibly attractive. Historically so. Fundamentals have been strong, P/E ratios are low, and the valuation spread compared to the S&P 500 is the widest in our firm’s history.
The value cycle held back our results for a while, but once it bottoms, we believe we have the ingredients to drive hundreds of basis points of annual outperformance for the next several years. Value upcycles historically have lasted 8.5 years on average, so while the last four months of 2019 were great, history would suggest it is just the tip of the iceberg.