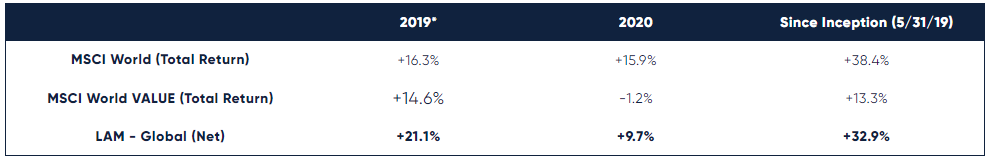
The pandemic tested our mettle, but our strategy and the companies in our portfolio navigated well through the volatile environment. We seek to own attractive businesses at attractive valuations, and this discipline helped us manage through a challenging time with confidence. Despite a rocky start to 2020, our portfolio ended up 9.7% (net) for the year.
After a bruising first quarter for global value stocks, it would have been hard to predict a solid gain in the portfolio this year. The cheapest stocks were hit especially hard at the onset of the pandemic, and the first quarter of 2020 marked only the second quarter our strategy has underperformed the MSCI World Value index since inception in June of 2019. Most of this underperformance came during the first three weeks of March before a sharp recovery. In the first quarter, we underperformed the MSCI World Index by 14 percentage points, but since then we outperformed by 21 percentage points, ending the year 620bps behind the MSCI World, but 1,080bps ahead of our style benchmark, the MSCI World Value.
We managed through the year with a high-single-digit return, but value in general did not fare as well. This unusual decline in cheap stocks we believe has created an incredibly attractive opportunity set. Value stocks are now trading with historically wide spreads versus the market, which has typically led to sustained periods of outperformance. We have performed well in a difficult period, and we are looking forward to our results whenever the value winds are at our back.
THRIVE AND SURVIVE
While the COVID virus created an economic crisis like no other, we had good reason to believe that, on average, there was no more risk from the pandemic in our portfolio than in the overall market. At Lyrical, we have three requirements for every investment – Value, Quality, and Analyzability, or in other words, Cheap, Good, and Simple. One of the reasons we want to buy quality / good businesses is because they are resilient and can adapt. When you own a stock for 7-8 years on average, as Lyrical has done historically in its U.S portfolios, it is likely that you will own it through a recession. That is why a key part of our due diligence is to understand how each business will respond to a weak economic environment. We want to own businesses that can not only thrive when times are good but also easily survive when times are tough.
Our disciplined underwriting paid off in 2020 as the fundamentals of our portfolio were better than the MSCI World Value index and similar to the MSCI World Index. As shown below, 2020 EPS revisions and earnings for our portfolio declined less than the MSCI World Value and were in line with the MSCI World index. This did not surprise us. We invest in companies with durable competitive advantages, flexible cost structures, strong balance sheets, and healthy free cash flows. These qualities allow companies to persevere during economic setbacks. While we did not know what shape this particular crisis would take, we had already stress-tested our companies by analyzing their performance through extreme periods like the Global Financial Crisis, when their earnings had held up better than the market’s.

Despite the relative resiliency of the businesses we own, many of our stocks were punished worse than the market during the sell-off. As of March 18, 2020, 80% of our stocks were underperforming the MSCI World Index, down an average of 47.1% year-to-date, compared to the MSCI World down 33.0%.
Given the performance of our portfolio’s fundamentals, we think the early sell-off in our stocks is an example of the market behaving emotionally. Falling stock prices can create a vicious cycle as they scare more investors into selling, which then causes prices to fall more. Stock prices go from being an indication of a company’s worth to reflecting pure emotion. Of course, our companies were hurt by the pandemic, but they were hurt about as much as the market. Furthermore, our businesses’ long-term earnings power is mostly unaffected and, in some cases, has improved because of COVID-19.
SOME CLEAR EXAMPLES
Let’s look beyond the aggregate portfolio data to examine a few stock examples that help show how the market overreacted (although, explaining why isn’t as easy). Below, we show the 2020 earnings estimate revisions and earnings changes for four of our companies—NXPI, Ashtead, Whirlpool, and Element—compared to the market. We also show that these stocks underperformed significantly through March 18th, only to rebound dramatically in the ensuing months.
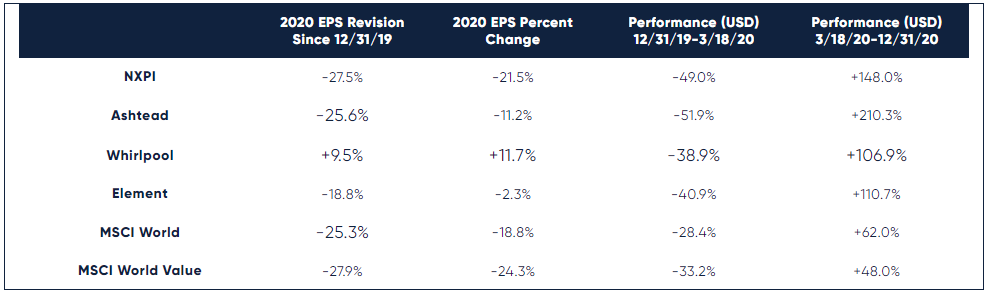
The examples above illustrate how owning resilient businesses, supported by detailed fundamental analysis, can make it easier to maintain our conviction even in a panic-driven market.
THE REPORTS OF VALUE'S DEMISE ARE GREATLY EXAGGERATED
While our portfolio has performed similarly to the MSCI World since the inception of our strategy, the MSCI World Value Index has significantly underperformed. In fact, the MSCI World Value Index has been underperforming for so long that we are frequently asked if value investing is broken. We can understand the question. Since 2017, the MSCI World Value Index has underperformed the MSCI World by 40 percentage points. Furthermore, the MSCI World Value Index has underperformed the MSCI World in 12 of the past 14 years.

It is our view, though, that it is the value index that may be broken, but not value investing. Instead of looking
at the performance of the MSCI World Value Index, if you look at the performance of the cheapest stocks in the
global developed markets, you see a very different picture emerge. The cheapest stocks have outperformed
the MSCI World Value in 11 of the past 17 years. As you can see above, the cheapest quintile of our universe
has outperformed both the MSCI World and MSCI World Value indices by 210bps and 410bps, respectively per
annum, going back to 2004 which is as far back as we have reliable data.
YOU CAN'T GET VALUE FROM AN INDEX
Our cheapest quintile outperforms the MSCI World Value because it has only one goal: to find the cheapest companies based on long-term earnings power. A value investor wants to maximize future cashflows for the cheapest price possible, and our valuation quintiles therefore sort based on five-year forward P/E’s. MSCI has other ideas in mind when it constructs its value index, which oddly chooses to favor companies with low levels of growth. Here’s how it works. For each constituent in the MSCI World Index, MSCI assigns a value score and a growth score. Stocks with high value scores and low growth scores go into the value index. Stocks with high growth scores and low value scores go into the growth index. But what about stocks that have a high value score and a high growth score? These are some of the best opportunities and where we spend most of our time sourcing ideas – cheap stocks with high growth. But, to MSCI, these stocks confuse the algorithm, so they are included in both the Value and Growth indices at partial weights, diluting their influence.
EXTREME TIMES CREATE EXTREME OPPORTUNITIES
While value stocks have massively outperformed over the long-haul, they go through downcycles like we saw in 2008, 2018, and in early 2020. These downturns have historically created some of the best opportunities to buy value. Below, we show the median return to fair value for the cheapest quintile, compared with our universe median return to fair value. The shaded blue area shows that the spread between the upside available in the cheapest stocks is about 102% higher than that of the broader global market. That valuation gap is as wide it has been in any period over the past 17 years apart from the global financial crisis.

NOT ALL VAULUE FUNDS WILL BENEFIT
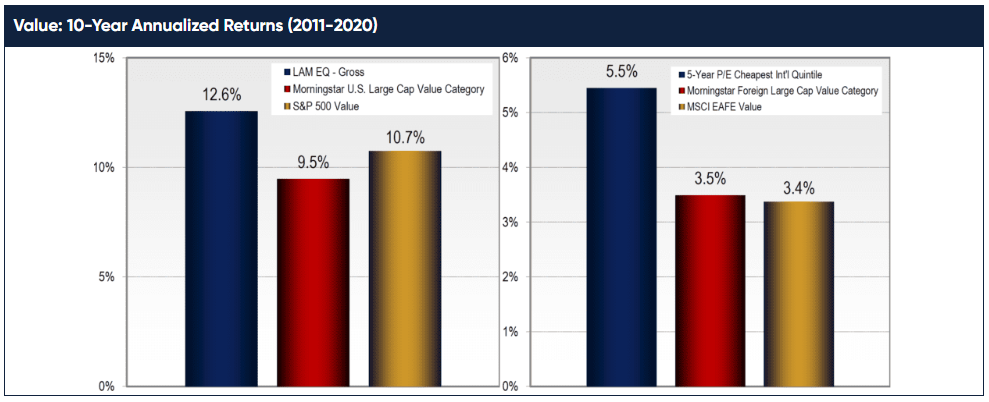
We believe the prospects for value stocks are great, but we have our doubts that many value managers will capitalize on them. In both the U.S. and Non-U.S. markets, our value peers have performed like the value benchmarks over time, and we know that tracking this index is not a recipe for alpha. As shown below, the Morningstar categories for U.S. and Foreign Large-Cap Value have performed similarly to the S&P 500 and EAFE Value Indices, while materially underperforming our fund’s performance in the U.S. and our cheapest quintile outside the U.S. stocks (which we use in lieu of our performance since we do not have a long enough track record to compare against).
THE LYRICAL WAY
At Lyrical, we do things differently. With a basic premise that a security’s intrinsic value is the present value of future cash flows, we are looking long-term. We value our businesses based on their five-year forward sustainable earnings power. Because we incorporate five years of growth into our earnings estimates, we identify a different group of companies as value stocks than does MSCI: companies with growth and value.
Our cheapest quintile is a fertile place to begin our hunt for value investments, but our performance in 2020 helps show why the real work comes after that. Even though we screen more effectively than the MSCI for value, we know the cheapest quintile is still full of a lot of junk. In 2020, we outperformed our cheapest quintile by 1,170bps, as the fundamentals of our companies held up better. In the U.S., we have outperformed the cheapest quintile by 270bps annualized over 12 years. The cheapest quintile of our screen is a starting point; it allows us to sort our universe efficiently and effectively, so we are spending our time researching the most fruitful investment candidates. From that point, we conduct the deep fundamental analysis to assess business quality and investment controversies.
In some ways, our research process that whittles down our 500-name cheapest quintile to our ~60-stock portfolio is more about saying ‘no’ than ‘yes’. As a result of passing on most businesses in the cheapest part of the market, we do not own what many consider typical value stocks. Within the cheapest quintile, there are many stocks that deserve to be cheap: slow-moving, highly regulated banks, complicated conglomerates, sprawling oil and gas companies, and more. Our companies include: the #1 market share smart grid maker, the #1 and #2 global music labels, a leading European online gaming company, a print-on-demand marketplace for independent artists that is growing 25%+, an internet-of-things software provider, and more.

We own compounders with an average ROIC above 15% that have grown their earnings, through two downturns, by 5.8% per annum since 2007, compared to the MSCI World at 2.3%, as you can see above. Even though our portfolio has had stronger earnings, it is also cheap, with an estimated upside to fair value of 74% for our portfolio, just above that of the cheapest quintile. We expect this uncommon combination of value and growth to drive outperformance for years to come.
CONCLUSION
Our core objective is to sift through the cheapest stocks to find great businesses, investing in the ‘gems’ amongst the ‘junk’. So far, we believe we have been able to do just that. Despite launching our fund amidst the weakest value environment since the great financial crisis, we are proud to report we have outperformed the MSCI World Value benchmark by 1,960bps (net, inception-to-date), even as the cheapest quintile has underperformed that benchmark by 810bps.
2020 was a period that tested our process and team. By focusing on the long-term earnings power of our businesses, and not on daily stock moves, we were able to make good investment decisions in the face of great – 7 – uncertainty. Now with value stocks and our portfolio at highly attractive levels, we have great expectations for our future returns.
We know that what matters over the long run is getting the earnings for our businesses right, and we are happy to be patient if the market disagrees with us in the short-term. We count ourselves lucky to have clients that allow us to invest with this long-term horizon that we believe will allow us to generate alpha for years to come.
We thank you for your confidence, and, as always, we welcome your inquiries.
MOREOVER, PAST PERFORMANCE IS NOT NECESSARILY INDICATIVE OF FUTURE RESULTS.