As the economy reopens, COVID is still wreaking economic havoc, but now in the form of inflation. Demand has come back strong after being impacted by lockdowns, but supply chains and labor forces are still recovering. With demand outstripping supply, shortages and upward price pressures are prevalent. While inflation has been bad for the broad market in the past, it has nonetheless been good for value stocks, a pattern we hope to see continue with any current bout of inflation.
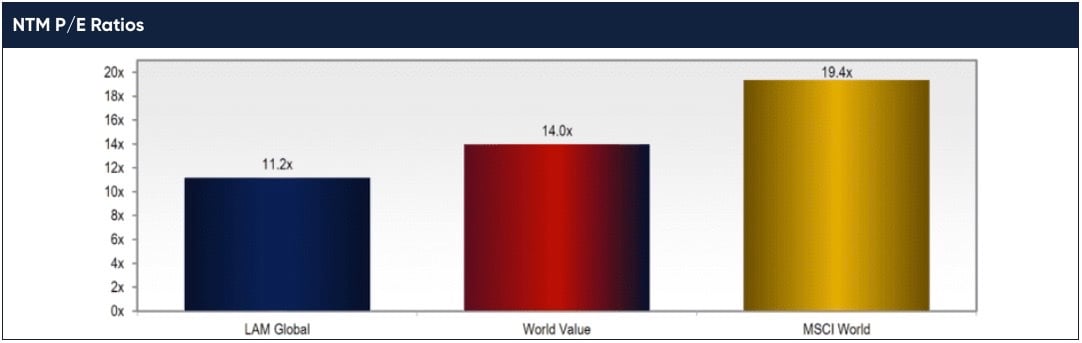
We head into 2022 well positioned. Our portfolio enters 2022 with a lower valuation than it started 2021 due to earnings growth and stock replacements. Moreover, COVID gave us deeper confidence in the fundamental strength of our businesses, whose earnings were revised down less than the market in 2020 and then revised up more in 2021. With a long-term earnings growth profile better than the MSCI World, our portfolio trades at nearly a 60% discount as of year-end, and our estimated upside to fair value is higher than usual at about 70%. While the strategy has performed well since inception, considering the portfolio’s attractiveness we believe the best is still yet to come.
RETURN OF THE VALUE FACTOR
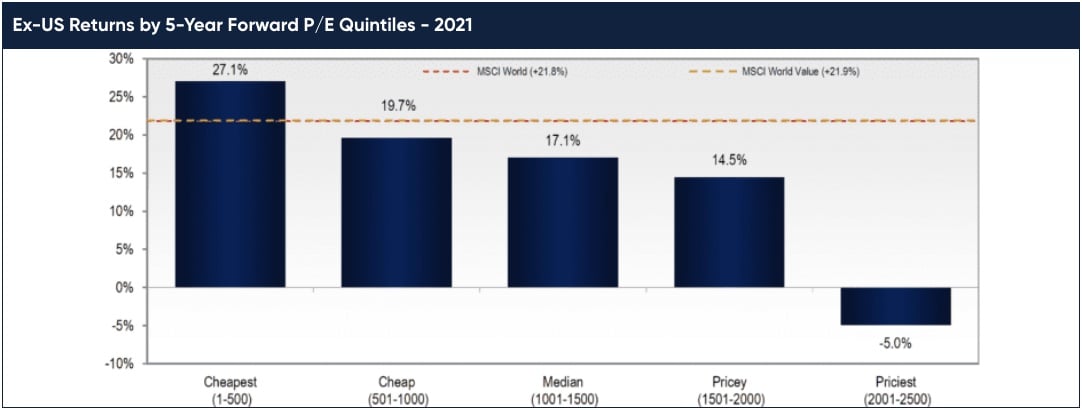
In 2021, the value factor once again returned to its historical norm, meaning a strong correlation between returns and valuation metrics. When we mention “value stocks” we are referring to the stocks with the lowest P/E ratios in our universe of the top 2,500 global stocks.
In the table below, we show the 2021 returns of our universe of the top 2,500 global stocks, sorted by P/E quintiles. The cheapest stocks with the lowest P/Es had the highest returns, and as each quintile got pricier with higher P/Es, the returns got lower.
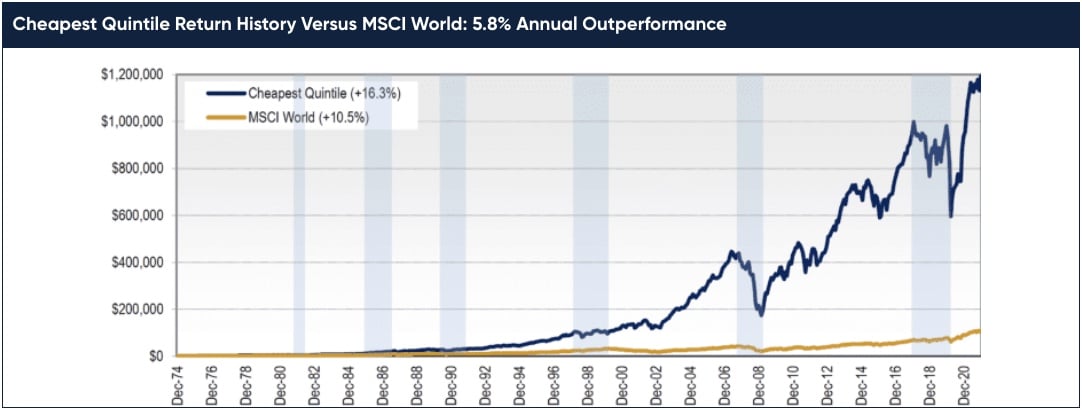
We believe this is just the beginning of value’s outperformance. Looking back over the past 47 years in global stocks, we find that the cheapest quintile outperformed by nearly 600 bps per year and about 80% of the time as shown below. Our hunting ground has gone through several rough patches—six periods since 1975 shaded in the chart below—but each of those periods presented a compelling opportunity to buy value. We’re about one and a half years into the current upcycle, and history suggests there are many more years to go.
RETURN OF INFLATION
Until 2021, it had been almost 40 years since we last saw a period of high inflation globally. The US Federal Reserve and the European Central Bank each have a 2% target for inflation, measured as the Consumer Price Index (CPI) in the US and the Harmonized Index of Consumer Prices (HICP) in Europe. In April, the CPI rose above 4% and has remained above 4% for the last nine months, with the last reading of 7% in December. The HICP has now been running above 2% since May 2021, most recently reaching 5% in December.
Since it has been such a long time since inflation was a factor, we examined historical data to analyze the performance of value stocks during periods of inflation. Since 1960, there have been three distinct periods of elevated inflation in the US. As shown on the table below, in each of those periods value stocks (defined as the cheapest quintile) outperformed the S&P 500.
The highlighted row in the table below covers “The Great Inflation” period in the US. This is the most extreme case of inflation in the last 40 years when CPI averaged 9% for a decade. During that decade, the cheapest stocks in the market generated outperformance of 10.8% per annum, as shown on the graph below.
The results are similar in Europe, where, since 1975, there have been two distinct periods of inflation. As shown in the table below, in each of those periods, value stocks outperformed the MSCI EAFE, including 11 years of 3.7% alpha for value stocks during the 1970’s and 1980’s when CPI was stuck near 10%.
While value stocks in general have a history of outperformance in inflationary times, it is the quality of our companies that gives us confidence in this environment. We have seen the impact of eight months of above-target inflation so far and, on average, our companies have been able to mitigate or benefit from the inflationary effects. Since May 2021, our portfolio’s consensus 2021 and 2022 EPS estimates have been revised up 11.4% and 6.2% compared to 6.3% and 3.2% for the MSCI World. Let’s take a closer look at how our companies have managed this environment.
In an inflationary period, it is important for a business to have pricing power. Without pricing power, rising costs will squeeze the margins of a business that cannot pass along those costs to customers. The companies we are invested in possess several forms of pricing power. Some can increase prices because they provide critical products that represent a small portion of total cost for their customers. We own SK Kaken, which controls more than 50% of the architectural paint market in Japan. The quality of paint determines the strength and permanence of the coat, but the paint itself only represents about 15% of the cost of a project. As such, contractors choose paint based on brand and technical capability rather than price. SK Kaken has grown its earnings at a 9% rate since 2000 and trades for only a 13x forward P/E, before giving the company credit for the 103% of its market cap that it holds in net cash. Yes, it trades for less than net cash!
Other companies we own derive pricing power from dominant local positions. HCA is a great example of this. HCA is the largest private healthcare services provider in the US, processing more than 5% of all healthcare services in the country. But HCA’s competitive advantage comes less from its national footprint and more from its dominant local footprints. In HCA’s key markets they have a 25% market share of health procedures. For example, in Nashville alone, HCA has 13 hospitals, 57 doctor’s offices, 21 specialty imaging centers, and more. This makes it very hard for an insurance provider in Nashville not to cover HCA facilities in-network and allows HCA the bargaining power to consistently increase prices at or above healthcare inflation. HCA has grown its earnings at an 18% annual rate over the past decade and trades for only 13.5x earnings today.
This bottom-up perspective along with the historical data lead us to believe inflation should be a positive factor for us.
FOLLOW THE FUNDAMENTALS
LONG-TERM THINKING IS OUR EDGE
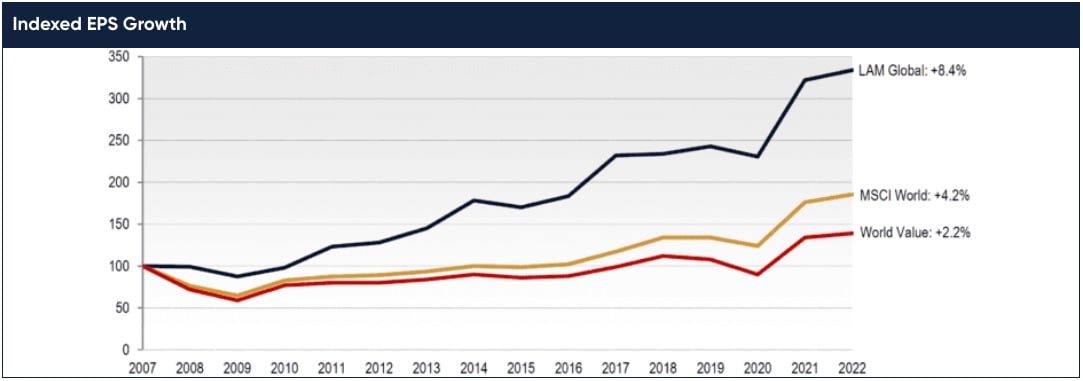
Many low P/E stocks have flat or declining earnings. This is especially true in international markets where large banks and cyclical business make up a large chunk of the cheapest quintile. Businesses with low P/Es, but with flat or declining earnings are not cheap; they are expensive. This is why we are highly selective within the cheapest quintile of stocks, seeking to only buy simple-to-understand, high-quality, and growing businesses. The result is that our portfolio has had superior earnings growth, compared to both the MSCI World Index and the cheapest stocks in the market. As you can see below, the companies in our portfolio have generated 8.4% annualized EPS growth going back to 2007 (including two economic recessions). That is significantly above the 4.2% for the MSCI World Index and 2.2% for World Value.
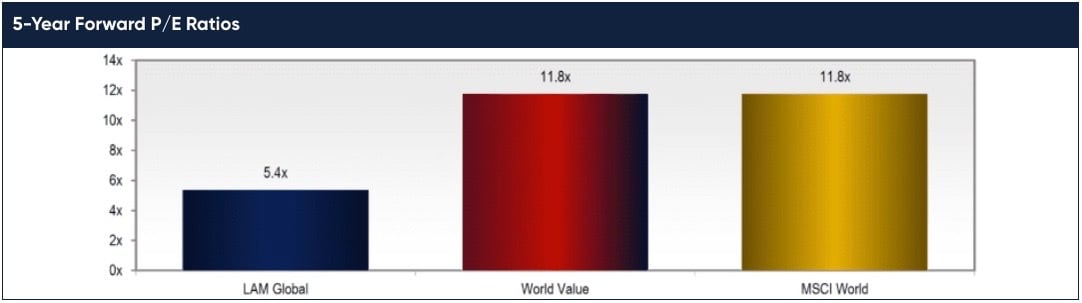
Because of that growth, on a long-term basis our portfolio is even cheaper. As shown below, our portfolio trades at only 5.4x our estimate of five-year forward earnings, while the slower growth MSCI World Index trades at a 120% premium to that multiple. We believe it’s this uncommon combination of value and growth that drives strong and sustainable returns to our clients, well above what near-term value factors can achieve.
CONCLUSION
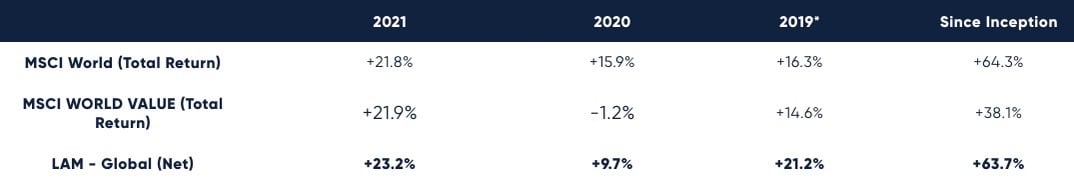
We had a good year, beating both the World and World Value Indices by around 100 bps, and we continue to think we are still in the early stages of a value upcycle. Historically, value upcycles have lasted six years on average and the past three upcycles have each been seven to nine years long. The current cycle started in June 2020, so we think there is plenty of runway ahead.
We have now outperformed the MSCI World Value by 2,560 bps since inception, and we will have a full three-year track record later this year. We feel good about that performance, but we think the best is yet to come. We have yet to see such a good combination of value and growth in the portfolio, and the upside in our portfolio—approximately 70% by our estimates—is near the highest we’ve seen.
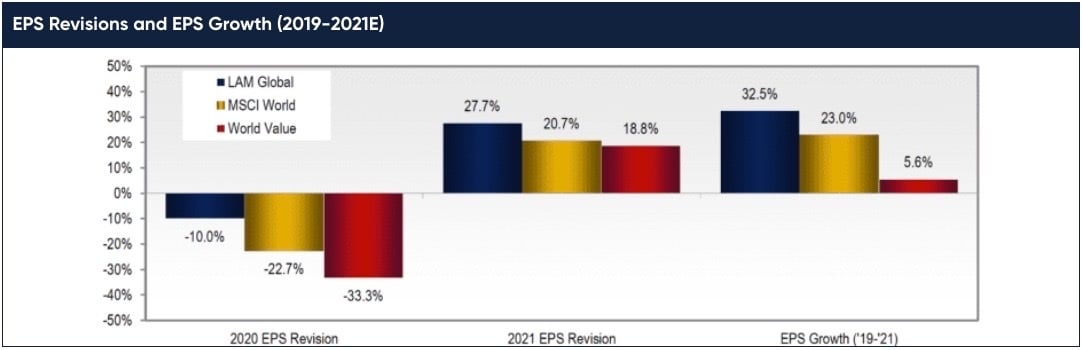
The COVID shutdown and recovery gave us strong evidence of our ability to select good, resilient businesses within the cheapest quintile. The stocks we own were more resilient in the shutdown and showed better strength in the reopening, outgrowing the MSCI World earnings over 2020-2021 by nearly 10 percentage points despite trading at a significant discount.
As bottom-up stock pickers, we will continue to focus on the micro and select companies that perform well in any macro situation. That said, if we’re entering a period of sustained inflation, we won’t protest. History suggests value is the place to be in such an environment, and we feel strongly the fundamentals of our businesses will hold up if pricing continues to surge.
Looking forward, we anticipate strong returns both absolute and relative. Our portfolio trades for less than half of the MSCI World on a longer-term basis, and we see one of the highest levels of upside since our launch.
We thank you for your confidence, and, as always, we welcome your inquiries.