Looking forward, we see great opportunity in our value impact stocks. With our Global portfolio trading at a 39% discount to the MSCI World despite better earnings growth, we are excited about our prospects.
THE MAGNIFICENT SEVEN
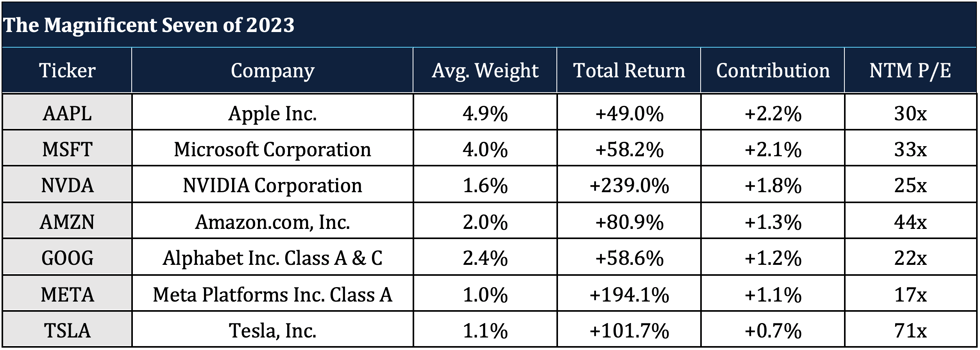
By far, the biggest contributor to the 2023 performance of the MSCI World was The Magnificent Seven stocks. The Magnificent Seven is the popular nickname for the seven US mega-cap growth stocks that drove nearly half of the return for the MSCI World, in 2023. Specifically, these seven are: Microsoft, Apple, NVIDIA, Amazon, Meta, Tesla, and Alphabet.
We have not owned any of the Magnificent Seven. First, the only credible impact case amongst these—in our opinion—is Tesla. Second, we are disciplined value investors, these stocks do not fit in the value category. The priciest of the seven are Tesla at over 70x forward earnings and Amazon at 44x. Microsoft and Apple have P/Es in the 30s, and NVIDIA and Alphabet have P/Es in the 20s. META at 17x is the only one with a P/E similar to the MSCI World Index, but it is still more than 50% pricier than our P/E of less than 11x.
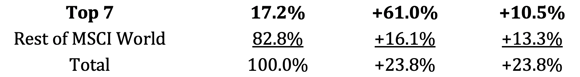
While we have seen FANG stocks propel equity markets over the last decade, their impact on the return of the MSCI World in any of those years was nothing compared to what the Magnificent Seven did in 2023. Despite the MSCI World being a global index, these seven U.S. stocks still held a combined average index weight of 17.2%. With a weighted average return of 61.0%, these seven stocks contributed an astounding 10.5 percentage points of the 23.8% index return.
The rest of the MSCI World, which includes almost 1,500 stocks, returned 16.1%, which is 45 percentage points lower. While our GIVES composite underperformed the full MSCI World, it outperformed the MSCI World, excluding the Magnificent Seven, by 30 bps.
IMPACT IS RARE
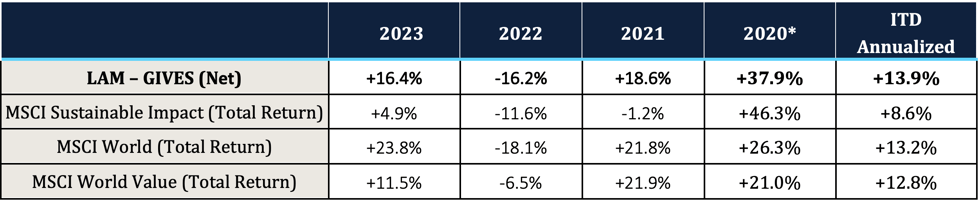
In 2023, the sustainable investing space performed poorly, with the MSCI Sustainable Impact index lagging the MSCI World by 18.9 percentage points. We suspect one reason for the broad underperformance is that sustainability-focused investors crowded into obvious impact businesses, despite their unattractive valuations.
Finding impactful businesses is not easy. To help see why, consider just how hard it is to screen for these companies. To start, industry classifications aren’t helpful. Of the 158 sub-industries in S&P’s 11 sectors, there are only two obvious categories to look for impact: Renewable Electricity and Environmental Services. In those two sub-industries, there are just 22 stocks in our universe of the largest 2,500 developed market stocks, and they trade at an average of 29x forward EPS. This is not a fertile hunting ground for value investments.
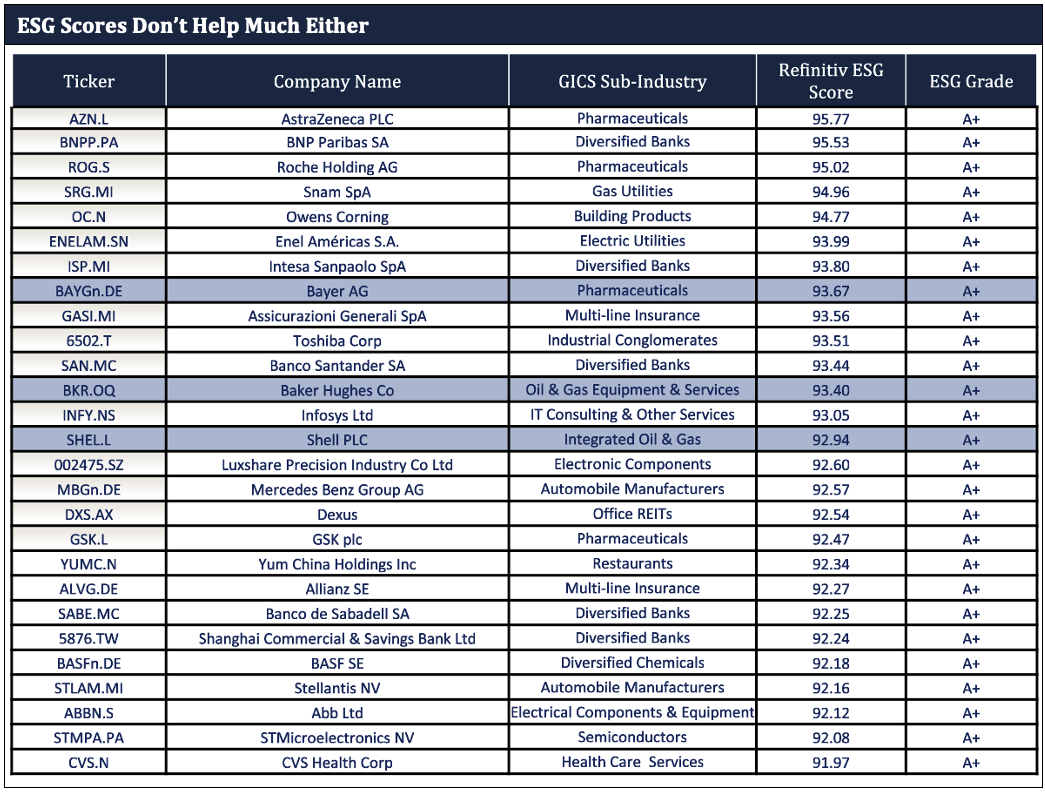
ESG scores are also not helpful in screening for impactful businesses. Consider the table below showing Refinitiv’s top ESG rankings from our 2,500-stock universe. The 8th best ESG company out of 2,500—according to Refinitiv—is Bayer AG. Through its disastrous 2018 acquisition of Monsanto, Bayer is the owner of Roundup pesticide, which has been linked to more than a 100,000 cases of cancer for which the company has paid out billions of dollars in lawsuits. Bayer gets an A+ ESG grade from Refinitiv.
Coming in at number 12 with another A+ rating is Baker Hughes, which provides drilling equipment and services that enable shale drilling in the United States. And two spots behind Baker Hughes is Royal Dutch Shell, another oil and gas powerhouse. Shell has made a minor push into renewables, which now account for 4% of its profit. However, the company ranks as one of the 10 largest emitters of all global companies and is responsible for more than 1% of total global GHG emissions, according to the CDP.
CROWDING INTO OBVIOUS IMPACT
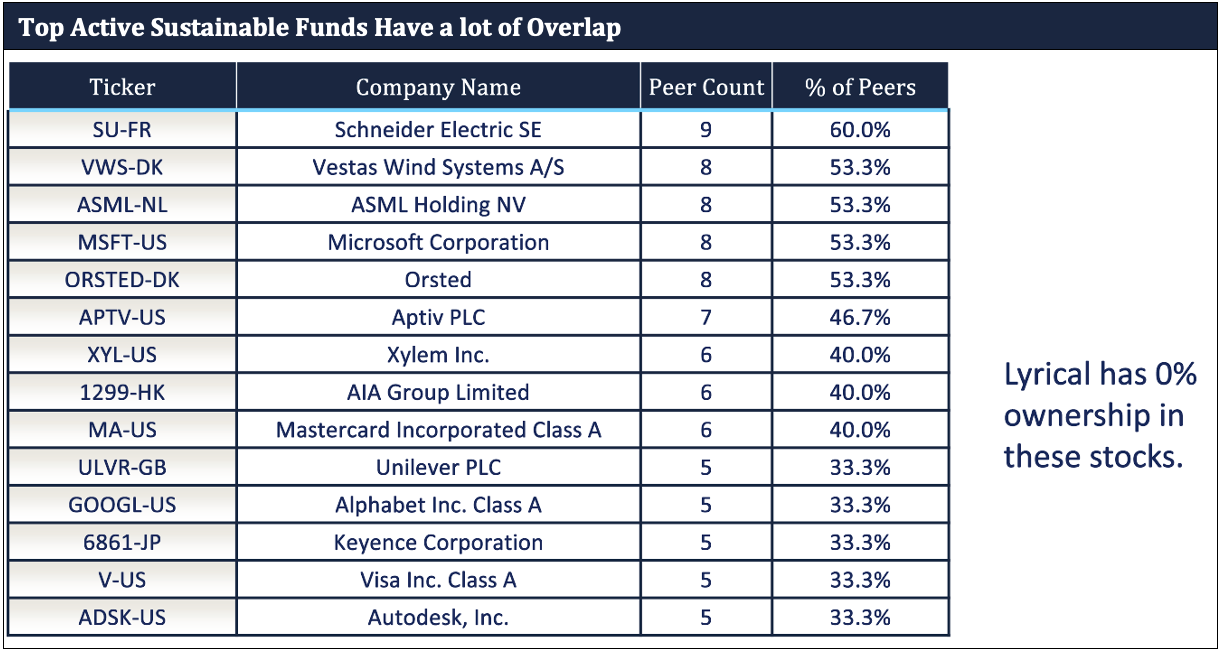
Given how difficult it is to screen for impact, it’s unsurprising that many impact funds own similar, obviously impactful stocks. We used the eVestment database to look at the holdings of the largest 15 actively managed funds that had less than 100 holdings and include the word “Sustainable” or “Impact” in the name. These funds may be actively managed, but we found that they look an awfully lot alike. Below, we show the most frequent holdings of these 15 funds. 14 stocks were found in 5 or more funds, and Schneider Electric showed up in 9 of the 15 funds we studied.
VALUATION MATTERS
There’s a lot to like about obvious impact businesses; not only do they improve the world; they also typically benefit from secular growth. However, overpaying for any business, even an impactful one, will generate a poor return.
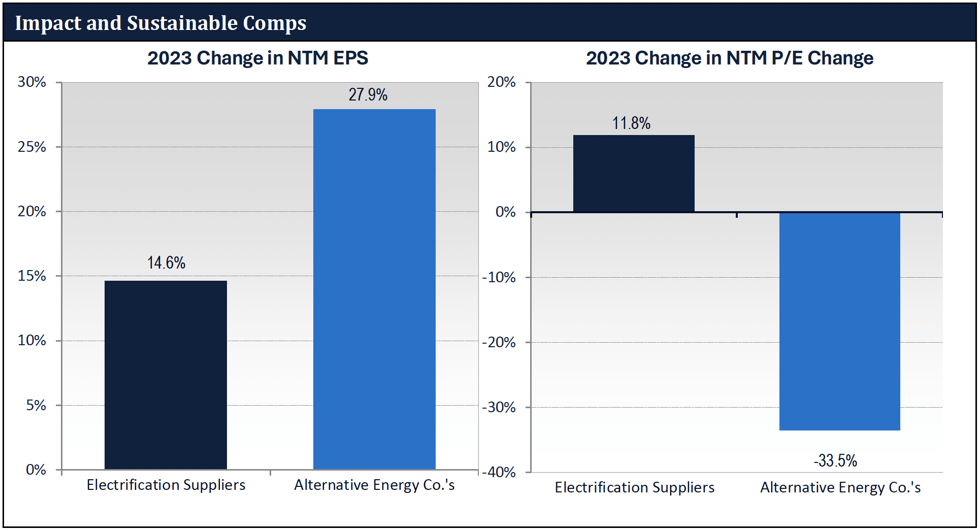
To understand that dynamic better, let’s look at the 2023 performance of two groups of companies aligned with the energy transition. First are the popular and expensive alternative energy companies, including Enphase and SolarEdge. Second, we have the cheap and less popular electrical suppliers, including two companies we own: Wesco and Rexel.
The alternative energy companies have attractive fundamentals, but they were too expensive. As shown below, in 2023 these companies had fantastic earnings growth of 27.9%, handily beating the 14.6% growth of the suppliers. However, the alternative energy companies had an average return of -14%. Their problem wasn’t growth; it was valuation. As questions were raised during the year about the long-term pace of renewables adoption, this group of companies saw a de-rating of -33.5% in 2023. Even after this multiple decline, these stocks still ended the year at a lofty 26.2x P/E. On the other hand, electrical suppliers only grew earnings at a 14.6% clip, but they started the year at a 16.5x P/E, which allowed for multiple expansion during the year.
The suppliers may be less exciting businesses, but we think they are better investments because they have reasonable valuations. In GIVES, we look to benefit from the secular growth available to companies serving the energy transition, but we only invest in companies in the cheapest part of the market. Of all these companies, we own only two of the electrification suppliers, Wesco, and Rexel. These companies grew their earnings 15% on average during 2023 and trade for only 10x EPS, a 50% discount to electrification suppliers and a 60% discount to alternative energy companies.
LOOKING FORWARD
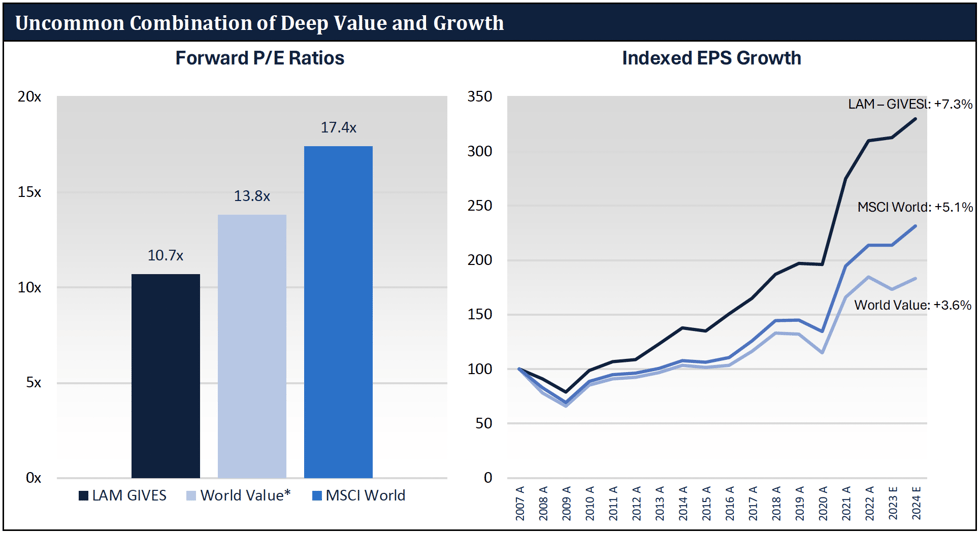
We own 22 other stocks like Wesco and Rexel, that trade for low P/E multiples while being exposed to the strong growth that comes from alignment with impact areas such as: decarbonization, the circular economy, improving consumer health and more. As you can see below, our GIVES portfolio trades at 10.7x forward EPS, a significant discount to the MSCI World Index of 17.4x. Yet this group of companies has also produced superior fundamental earnings growth, growing at 7.3% annualized from 2007 – 2024 expected.
 Source: Factset. See Notes below.
As value investors we often find ourselves in the less obvious parts of climate change. We’ll leave the more obvious impact companies with expensive valuations to others. We call it “impact in the trenches” investing. This has worked well for us so far, and we’re eager to continue harvesting the gains from the seeds we’ve planted. With the MSCI World index trading at more than a 60% premium to our portfolio despite its slower long-term growth, we anticipate strong returns going forward.
We thank you for your confidence, and, as always, we welcome your engagement.
Co-Portfolio Managers
RISK FACTORS:
General:
We do not attempt to time the markets or focus on weightings relative to any index. Accordingly, client returns are expected, at certain times, to significantly diverge from those of market indices.
Investing in securities involves a risk of loss that investors must be prepared to bear. Because we invest primarily in publicly traded equity securities, Lyrical believes the primary risk of loss is associated with securities selection and broad market movements, and wide and sudden fluctuations in market value can occur.
Force Majeure. Lyrical and its clients may be affected by force majeure events (i.e., events beyond the control of the party claiming that the event has occurred, including, but not limited to, acts of God, fire, flood, earthquakes, outbreaks of an infectious disease, pandemic or any other serious public health concern, war, terrorism, labor strikes, major plant breakdowns, pipeline or electricity line ruptures, failure of technology, defective design and construction, accidents, demographic changes, government macroeconomic policies, social instability, etc.). Some force majeure events may adversely affect the ability of a party (including a portfolio company or service provider) to perform its obligations until it is able to remedy the force majeure event. These risks could, among other effects, adversely impact the cash flows available from a portfolio investment, cause personal injury or loss of life, damage property, or instigate disruptions of service. In addition, the cost to a portfolio company or a client of repairing or replacing damaged assets resulting from such force majeure event could be considerable. Force majeure events that are incapable of or are too costly to cure can have a permanently adverse effect on a portfolio company. Certain force majeure events (such as war or an outbreak of an infectious disease) could have a broader negative impact on the world economy and international business activity generally, or in any of the countries in which we invest.
International Risks:
International holdings involve risks and considerations not typically associated with investing in U.S. companies. The performance of foreign markets does not necessarily track U.S. markets. Foreign investments may be affected favorably or unfavorably by changes in currency rates and exchange control regulations. There may be less publicly available information about a foreign company than about a U.S. company, and foreign companies may not be subject to accounting, auditing and financial reporting standards and requirements comparable to those applicable to U.S. companies. Foreign securities often trade with less frequency and volume than domestic securities and therefore may exhibit less liquidity and greater price volatility than securities of U.S. companies. There may be less governmental supervision of securities markets, brokers, and issuers of securities than in the U.S. Changes in foreign exchange rates will affect the value of those securities, which are denominated or quoted in currencies other than the U.S. dollar. Therefore, for foreign securities which are denominated or quoted in currencies other than the U.S. dollar, there is a risk that the value of such security will decrease due to changes in the relative value of the U.S. dollar and the securities’ underlying foreign currency. Additional costs associated with an investment in foreign securities may include higher custodial fees than those applicable to domestic custodial arrangements, generally higher commission rates on foreign portfolio transactions, and transaction costs of foreign currency conversions. Investments in foreign securities may also be subject to other risks different from those affecting U.S. investments, including local political or economic developments, expropriation or nationalization of assets, restrictions on foreign investment and repatriation of capital, imposition of withholding taxes on dividend or interest payments, currency blockage (which would prevent cash from being brought back to the U.S.), limits on proxy voting and difficulty in enforcing legal rights outside the U.S. Currency exchange rates and regulations may cause fluctuation in the value of foreign securities. In addition, foreign securities and dividends and interest payable on those securities may be subject to foreign taxes, including taxes withheld from payments on those securities.
GIVES additional risks:
While we believe the sustainability objective we pursue for GIVES accounts is consistent with achieving our objectives for performance and risk, GIVES accounts are necessarily more concentrated than our Global Value Equity strategy accounts. As well, by pursuing GIVES’s sustainability objective clients will not gain exposure to certain companies that might offer better investment returns.
“Fair and balanced” assessment:
You are entitled to a fair and balanced presentation, to inform any decision about investing with us. And, no such decision should be based entirely or predominantly on information in this document. By design, our investment approach differs from the norm in important ways. While those differences are intentional and, we believe, well-founded, we allow that those who act more conventionally, too, have reasons for doing so. We strongly encourage that you engage with our client service team to better understand our beliefs and our methods. Questions could be as general as “why value?” or as narrow as “why do you not conviction-weight positions?” for just two examples. Even as our strategies offer liquidity, we seek an alignment of long-term minded investors and our long-term orientation; the better you are informed, the more likely that match will be made.
DISCLAIMERS:
General:
Past performance is not necessarily indicative of future results. Individual results may vary based on timing of investments and/or other factors. There is no guarantee that the investment objective of our strategy will be achieved.
This document is confidential and does not convey any offering or the solicitation of any offer to invest in the strategy presented. Any such offering can only be made following a one-on-one presentation, and only to qualified investors in those jurisdictions where permitted by law.
The information included in this document is not being provided in a fiduciary capacity, and it is not intended to be, and should not be considered as, impartial advice.
“Forward-looking statements” contained herein can be identified by the use of forward-looking terminology such as “may,” “will,” “should,” “expect,” “anticipate,” “project,” “estimate,” “intend,” “continue,” or “believe,” or the negatives thereof or other variations thereon or comparable terminology. Due to various risks and uncertainties, actual events, results or actual performance may differ materially from those reflected or contemplated in such forward-looking statements. Nothing contained herein may be relied upon as a guarantee, promise, or assurance or as a representation as to the future.
Certain information contained herein has been obtained from third party sources and not independently verified by Lyrical. No representation, warranty, or undertaking, expressed or implied, is given to the accuracy or completeness of such information. While such sources are believed to be reliable, Lyrical does not assume any responsibility for the accuracy or completeness of such information. Lyrical does not undertake any obligation to update the information contained herein as of any future date.
More complete information about our products and services is contained in our Form ADV, Part 2
Registration with the SEC does not imply a certain level of skill or training.
Model or hypothetical performance:
Where we provide information about performance that is not the actual performance results of our investment strategies, please note that there are substantial additional limitations inherent in using such performance information. Those include, but are not limited to, that actual trading and the associated expenses did not occur, that market conditions change over time, and that no investor had the actual performance presented.
IMPORTANT NOTES:
Index Information:
Any indexes and other financial benchmarks shown are provided for illustrative purposes only, are unmanaged, reflect reinvestment of income and dividends and do not reflect the impact of advisory fees. Investors cannot invest directly in an index. Comparisons to indexes have limitations because indexes have volatility and other material characteristics that may differ from those of Lyrical’s strategies.
The MSCI World Index is an equity index which captures large and mid cap representation across 23 developed market countries around the world. With 1,480 constituents, index covers approximately 85% of the free float-adjusted market capitalization in each country.
The MSCI World Value Index captures large and mid cap securities exhibiting overall value style characteristics across 23 Developed Markets countries around the world. The value investment style characteristics for index construction are defined three variables: book value to price, 12-month forward earnings to price and dividend yield.
The MSCI ACWI Sustainable Impact Index is designed to identify listed companies whose core business addresses at least one of the world’s social and environmental challenges, as defined by the United Nations Sustainable Development Goals. The Sustainable Impact categories include: nutritious products, treatment of major diseases, sanitary products, education, affordable housing, loans to small and medium size enterprises, alternative energy, energy efficiency, green building, sustainable water, and pollution prevention. To be eligible for inclusion in the Index, companies must generate at least 50% of their sales from one or more of the Sustainable Impact categories and maintain minimum environmental, social and governance (ESG) standards. The parent index is MSCI ACWI. Constituent selection is based on data from MSCI ESG Research.
The S&P 500® is widely regarded as the best single gauge of large-cap U.S. equities. The index includes 500 leading companies and covers approximately 80% of available market capitalization.
EPS and Multiple Changes
The chart showing change in earnings per share depicts the historical change of earnings per share of the companies comprising the LAM Global Impact Value Equity portfolio as of December 31, 2023 using composite share holdings as of that date. This chart also shows the change in earnings per share of the MSCI World Index and the MSCI World Value Index over the same periods. Earnings per share is computed using consensus earnings data, which include certain adjustments from reported, GAAP earnings. Periods marked with an “E” include estimated earnings per share. LAM Global Impact Value Equity portfolio holdings are included from the earliest date of their available data.