BETTER EARNINGS, BETTER PRICES
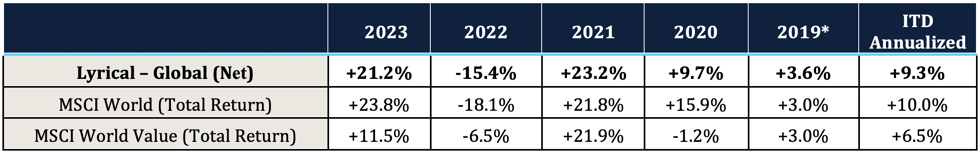
Summarizing our relative performance compared to the MSCI World Index, we had faster earnings growth, offset by less multiple expansion. As shown below, in 2023, our portfolio had 220 bps faster EPS growth than the MSCI World. Despite that faster growth, the MSCI World had 350 bps more multiple expansion. Thus, we believe the MSCI World did not deliver better fundamentals, it just got more expensive. While we would naturally prefer to outgrow AND outperform, we believe that if our companies keep outgrowing the market, they will outperform over time.
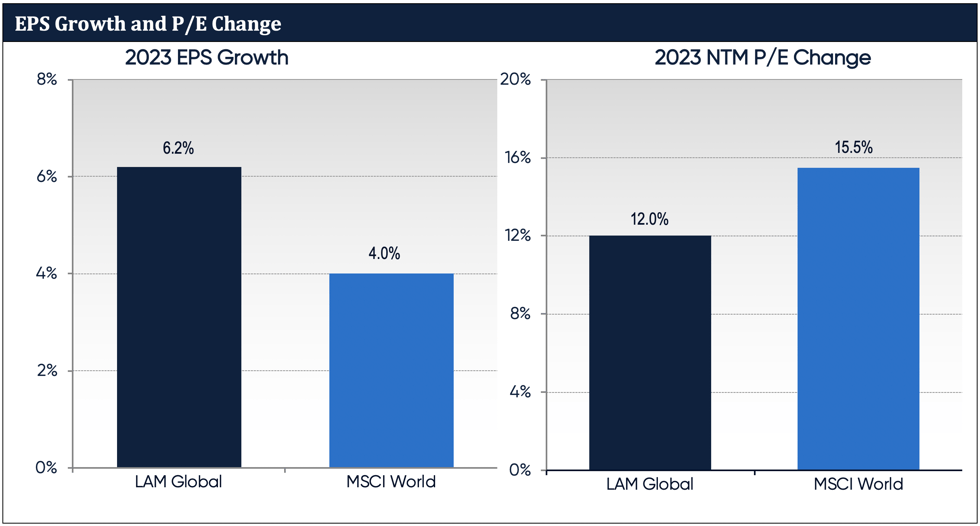 Source: Factset
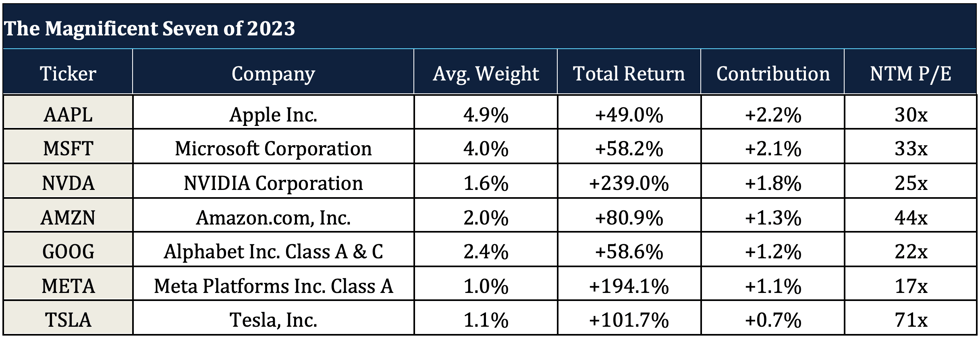
THE MAGNIFICENT SEVEN
By far, the biggest contributor to the 2023 performance of the MSCI World were The Magnificent Seven stocks. The Magnificent Seven is the popular nickname for the seven U.S. mega-cap growth stocks that drove nearly half of the return of the MSCI World, in 2023. Yes, these stocks accounted for 44% of the entire world index last year. Specifically, the seven are: Microsoft, Apple, NVIDIA, Amazon, Meta, Tesla, and Alphabet.
We have not owned any of the Magnificent Seven, which makes sense given that we are disciplined value investors. As you can see by the P/Es in the table below, these stocks do not fit in the value category. The priciest of the seven are Tesla at over 70x forward earnings and Amazon at 44x. Microsoft and Apple have P/Es in the 30s, and NVIDIA and Alphabet have P/Es in the 20s. META at 17x is the only one with a P/E similar to the MSCI World Index, but it is still more than 70% pricier than our Global Composite P/E of 10x.
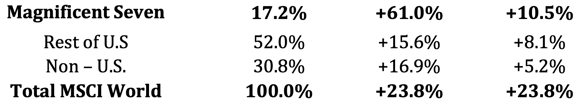
While we have seen FANG stocks propel the markets over the last decade, their impact on the return of the MSCI World in any of those years pales in comparison to what the Magnificent Seven did in 2023. Despite the MSCI World being a global index, these seven U.S. stocks still held a combined average index weight of 17.2%. With a weighted average return of 61.0%, these seven stocks contributed an astounding 10.5 percentage points of the 23.8% index return.
Perhaps surprisingly, if we exclude the Magnificent Seven, the remaining U.S. stocks performed worse than non-U.S. stocks. As you can see above, the rest of the U.S. stocks, which make up 52% of the MSCI World, were up 15.6% in 2023. This compares to the non-U.S. stocks, which were up 16.9%.
While our Global composite underperformed the full MSCI World by 260 bps, it outperformed the MSCI World, excluding the Magnificent Seven, by 510 bps.
THE OPPORTUNITY OUTSIDE THE U.S.
We believe non-U.S. stocks are unpopular today largely because they have produced weaker returns over the past ten years. Below, we show the rolling five-year trailing return difference between the MSCI EAFE and the S&P 500. For purposes of this analysis, we use the MSCI EAFE and the S&P 500, which are appropriate proxies for the U.S. and non-U.S. portions of the MSCI World Index.
When the bars are positive, as they were from 2003 to 2010, non-U.S. outperformed the U.S. When the bars are negative, that means non-U.S. underperformed the U.S. Over the past decade, the EAFE benchmark has underperformed by almost 8% per year.
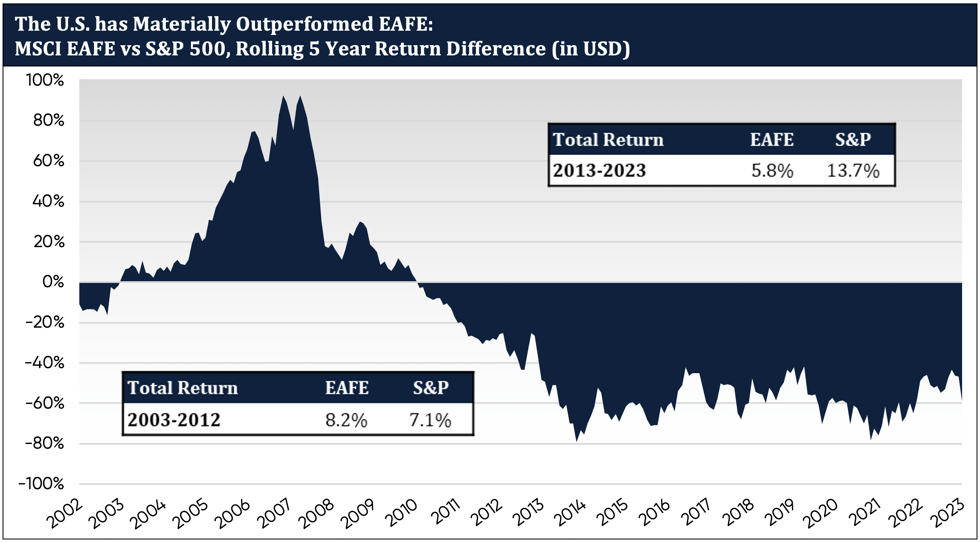
This persistent underperformance of non-U.S. stocks makes them easy to ignore. However, avoiding non-U.S. markets only makes sense to us if the poor returns have come from weak fundamentals, and this simply has not been the case.
SOLID NON-U.S. FUNDAMENTALS
Over the past 10 years, non-U.S. companies have had good fundamentals. The total return from an index or a stock can be broken down into three components: the return from fundamentals, the return from valuation, and the return from currency. The fundamental return is the amount of money you make from a company growing its earnings and the dividends you receive. As you can see at the top right in the table below, over the past decade the non-U.S. market has delivered a fundamental return of 8.9% per year, better than the 8.4% from the S&P 500.
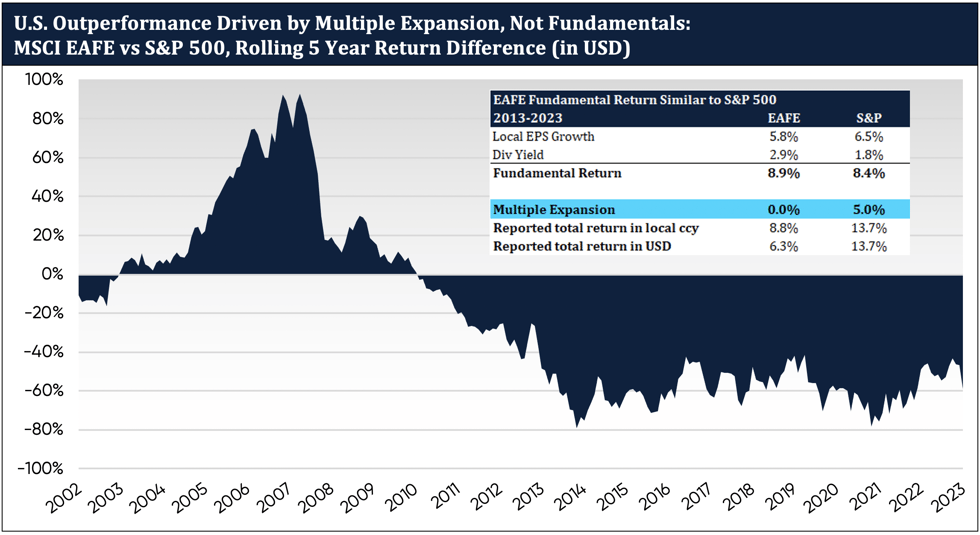
In other words, over the past ten years the S&P 500 total return has trounced the EAFE’s by more than 8%, and yet the fundamental drivers of return have been about the same.
If the companies outside the U.S. have been just as good fundamentally as their U.S. counterparts, how can we explain this huge outperformance by U.S. stocks? As highlighted in blue above, the U.S. outperformance has been driven by companies getting more expensive, not by companies growing faster. Multiple expansion has benefited the S&P 500 by 5% per year, while the EAFE multiple has remained the same. Investors have been willing to pay more for U.S. stocks, but this has not been supported by better fundamental growth.
SWIMMING AGAINST THE CURRENCY TIDE
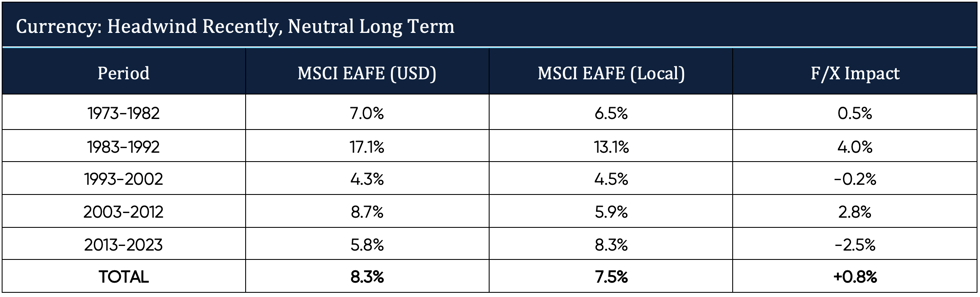
The other drag for non-U.S. stocks over the past decade has been currency, which reduced returns by 2.5% per year over this period. Currency has been a headwind for non-U.S. markets over the past decade, but historically it has had a more neutral impact. In the right column of the table below, we show the tailwind or headwind from currency from investing in developed non-U.S. markets over the long term. Since the early 1970’s, foreign exchange actually has been a slight benefit. However, the main point here is that developed market non-U.S. currencies ebb and flow relative to the U.S. dollar. Just like with valuation multiples, we expect that the significant negative drag from currency over the past decade is unlikely to be repeated.
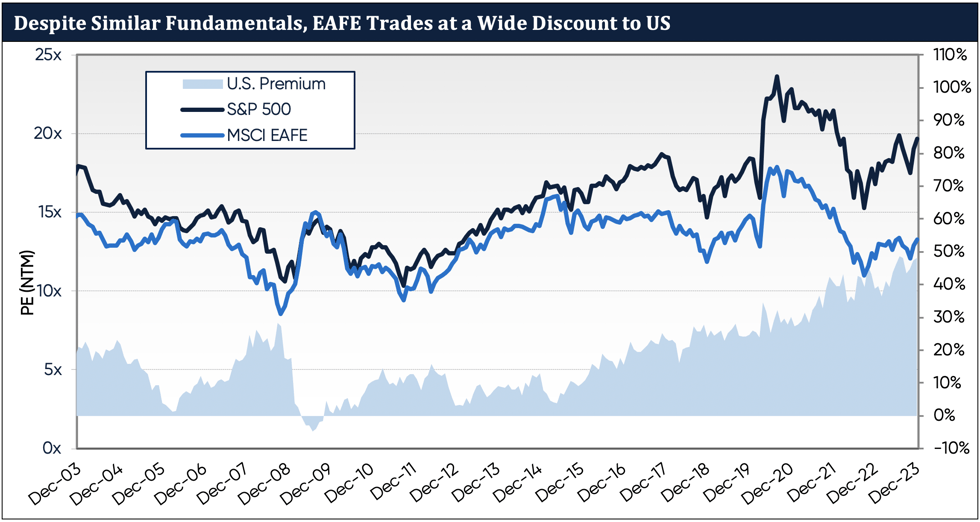
Because U.S. stocks have appreciated much more than non-U.S. stocks despite similar fundamentals, the valuation spread between the two markets has expanded to what we believe is an extreme level. This slide shows the P/E multiple for the S&P 500 in the black line and the EAFE in the blue line. The bars at the bottom show the spread, or how much more expensive the S&P 500 is relative to the EAFE.
 Source: Factset.
 There are a few points to make here. First, on an absolute basis, the EAFE is clearly cheaper. It trades just above 13x earnings, similar to the multiple reached at the bottom of the COVID collapse in 2020 and at a 7% discount to its 10-year average. The S&P 500, on the other hand, looks expensive. It trades at 20x earnings, near its historic highs, and an 11% premium to its 10-year average.
The bars at the bottom show that the S&P 500 is nearly 50% more expensive today than the EAFE, a wider premium than we’ve seen going back 20 years to 2003. Again, this is despite the fact that the fundamentals for the EAFE have been just as attractive.
THE OPPORTUNITY INSIDE THE U.S.
The above analysis begs another question for a value investor: if the U.S. market looks expensive, why have 57% of your portfolio there? The answer is that while the U.S. market looks expensive on average, the cheapest part of the U.S. market remains extremely cheap.
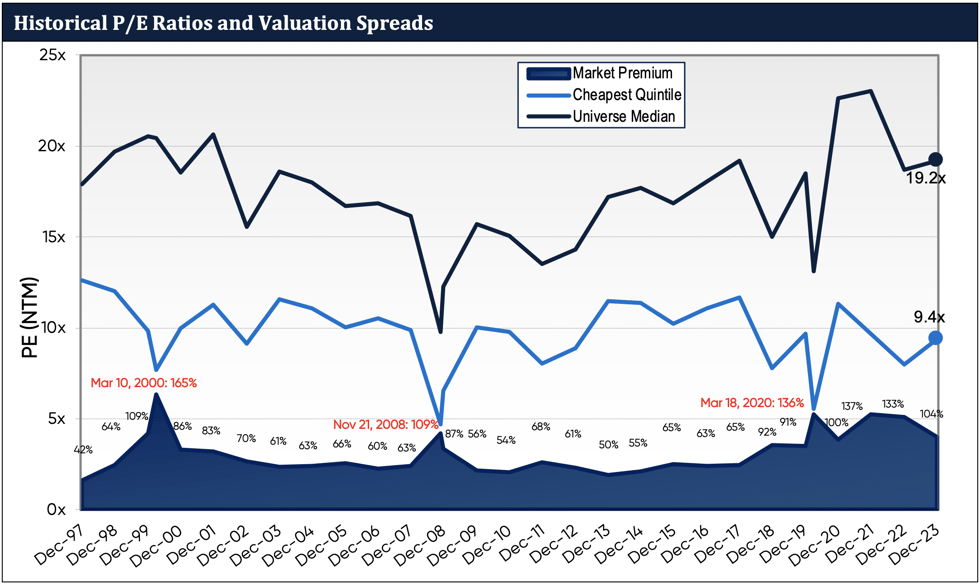
As you can see in the chart below, the cheapest quintile of stocks in the U.S. trade at just 9.4x NTM EPS, compared to 19.2x for the median U.S. stock. That means the U.S. market is trading at a valuation 100% more expensive than its cheapest part. This valuation spread between the market and cheapest part of the market is unusually high and similar to the wide spreads seen during the widest points of the Global Financial Crisis and the final moments of the 1998-2000 tech bubble - both historically good opportunities to buy value stocks.
 Source: Factset.
We continue to expect at some point this spread will revert to the pre-2018 levels, but we have no way to know when it might happen. Admittedly, the valuation spread has been stubbornly high for over three years now, but if we are right and the spread does revert, it could drive a significant amount of excess return, likely spread out over several years. There’s still a very good reason to invest in U.S. value stocks.
LYRICAL GLOBAL: BEST OF BOTH REGIONS
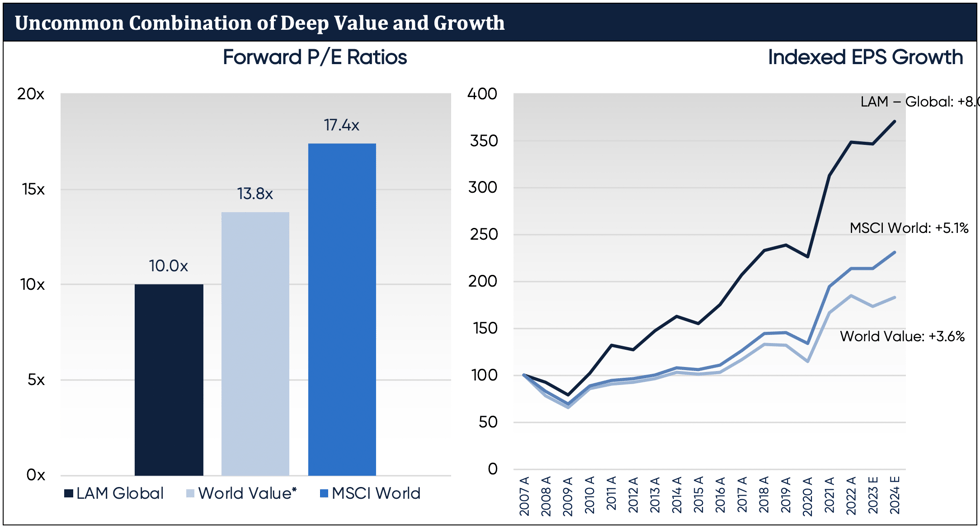
We believe the cheapest quintile of stocks, both in and outside of the U.S. present an excellent hunting ground for bottom-up stock pickers, and our process has led to a portfolio that is cheaper with better growth.
The stocks in our portfolios have a growth history of over 8% per annum going back to 2007, compared to 5.1% for the MSCI World. This outsized growth has come with less economic sensitivity than either the MSCI World or the MSCI World Value, meaning our earnings fell less in the past two recessions.
 Source: Factset. See Notes below.
What kind of price do you have to pay for better, less cyclical growth? Not a whole lot. As shown on the left side in the chart above, our portfolio ended the year valued at only 10x P/E, even after a 21.2% return in 2023. That’s more than a 40% discount for businesses that—to us—look better than the market in just about every way. This uncommon combination of both deep value and attractive growth is the signature characteristic of Lyrical’s investment approach.
CONCLUSION
We take away a lot of positives from 2023. The earnings of our investments were strong, and we had faster earnings growth than the MSCI World index. We outperformed our style benchmark of the MSCI World Value and outperformed our universe as measured by the MSCI World Equal Weight. We were not quite able to outperform the capitalization weighted MSCI World index, given the outsized contribution of the Magnificent Seven U.S. mega-cap growth stocks. This was particularly frustrating given that index performance was driven by great multiple expansion, not better fundamentals.
We live in the trenches of value investing, and what we see today are still incredible opportunities within the cheapest corners of the market, globally. Trading near the cheapest valuation relative to the U.S. in 20 years, the non-U.S. market is an obvious place for bottom-up stock pickers to find value. At the same time, while the U.S. market is expensive in aggregate, we believe the cheapest stocks in that market are extremely cheap on an absolute basis. It’s an exciting time to deploy our process, as we’re paying bargain prices for quality businesses all around the world.
We thank you for your confidence, and, as always, we welcome your inquiries.
Portfolio Managers
RISK FACTORS:
General:
We do not attempt to time the markets or focus on weightings relative to any index. Accordingly, client returns are expected, at certain times, to significantly diverge from those of market indices.
Investing in securities involves a risk of loss that investors must be prepared to bear. Because we invest primarily in publicly traded equity securities, Lyrical believes the primary risk of loss is associated with securities selection and broad market movements, and wide and sudden fluctuations in market value can occur.
Force Majeure. Lyrical and its clients may be affected by force majeure events (i.e., events beyond the control of the party claiming that the event has occurred, including, but not limited to, acts of God, fire, flood, earthquakes, outbreaks of an infectious disease, pandemic or any other serious public health concern, war, terrorism, labor strikes, major plant breakdowns, pipeline or electricity line ruptures, failure of technology, defective design and construction, accidents, demographic changes, government macroeconomic policies, social instability, etc.). Some force majeure events may adversely affect the ability of a party (including a portfolio company or service provider) to perform its obligations until it is able to remedy the force majeure event. These risks could, among other effects, adversely impact the cash flows available from a portfolio investment, cause personal injury or loss of life, damage property, or instigate disruptions of service. In addition, the cost to a portfolio company or a client of repairing or replacing damaged assets resulting from such force majeure event could be considerable. Force majeure events that are incapable of or are too costly to cure can have a permanently adverse effect on a portfolio company. Certain force majeure events (such as war or an outbreak of an infectious disease) could have a broader negative impact on the world economy and international business activity generally, or in any of the countries in which we invest.
International Risks:
International holdings involve risks and considerations not typically associated with investing in U.S. companies. The performance of foreign markets does not necessarily track U.S. markets. Foreign investments may be affected favorably or unfavorably by changes in currency rates and exchange control regulations. There may be less publicly available information about a foreign company than about a U.S. company, and foreign companies may not be subject to accounting, auditing and financial reporting standards and requirements comparable to those applicable to U.S. companies. Foreign securities often trade with less frequency and volume than domestic securities and therefore may exhibit less liquidity and greater price volatility than securities of U.S. companies. There may be less governmental supervision of securities markets, brokers, and issuers of securities than in the U.S. Changes in foreign exchange rates will affect the value of those securities, which are denominated or quoted in currencies other than the U.S. dollar. Therefore, for foreign securities which are denominated or quoted in currencies other than the U.S. dollar, there is a risk that the value of such security will decrease due to changes in the relative value of the U.S. dollar and the securities’ underlying foreign currency. Additional costs associated with an investment in foreign securities may include higher custodial fees than those applicable to domestic custodial arrangements, generally higher commission rates on foreign portfolio transactions, and transaction costs of foreign currency conversions. Investments in foreign securities may also be subject to other risks different from those affecting U.S. investments, including local political or economic developments, expropriation or nationalization of assets, restrictions on foreign investment and repatriation of capital, imposition of withholding taxes on dividend or interest payments, currency blockage (which would prevent cash from being brought back to the U.S.), limits on proxy voting and difficulty in enforcing legal rights outside the U.S. Currency exchange rates and regulations may cause fluctuation in the value of foreign securities. In addition, foreign securities and dividends and interest payable on those securities may be subject to foreign taxes, including taxes withheld from payments on those securities.
“Fair and balanced” assessment:
You are entitled to a fair and balanced presentation, to inform any decision about investing with us. And, no such decision should be based entirely or predominantly on information in this document. By design, our investment approach differs from the norm in important ways. While those differences are intentional and, we believe, well-founded, we allow that those who act more conventionally, too, have reasons for doing so. We strongly encourage that you engage with our client service team to better understand our beliefs and our methods. Questions could be as general as “why value?” or as narrow as “why do you not conviction-weight positions?” for just two examples. Even as our strategies offer liquidity, we seek an alignment of long-term minded investors and our long-term orientation; the better you are informed, the more likely that match will be made.
General:
Past performance is not necessarily indicative of future results. Individual results may vary based on timing of investments and/or other factors. There is no guarantee that the investment objective of our strategy will be achieved.
This document is confidential and does not convey any offering or the solicitation of any offer to invest in the strategy presented. Any such offering can only be made following a one-on-one presentation, and only to qualified investors in those jurisdictions where permitted by law.
The information included in this document is not being provided in a fiduciary capacity, and it is not intended to be, and should not be considered as, impartial advice.
“Forward-looking statements” contained herein can be identified by the use of forward-looking terminology such as “may,” “will,” “should,” “expect,” “anticipate,” “project,” “estimate,” “intend,” “continue,” or “believe,” or the negatives thereof or other variations thereon or comparable terminology. Due to various risks and uncertainties, actual events, results or actual performance may differ materially from those reflected or contemplated in such forward-looking statements. Nothing contained herein may be relied upon as a guarantee, promise, or assurance or as a representation as to the future.
Certain information contained herein has been obtained from third party sources and not independently verified by Lyrical. No representation, warranty, or undertaking, expressed or implied, is given to the accuracy or completeness of such information. While such sources are believed to be reliable, Lyrical does not assume any responsibility for the accuracy or completeness of such information. Lyrical does not undertake any obligation to update the information contained herein as of any future date.
More complete information about our products and services is contained in our Form ADV, Part 2
Registration with the SEC does not imply a certain level of skill or training.
Model or hypothetical performance:
Where we provide information about performance that is not the actual performance results of our investment strategies, please note that there are substantial additional limitations inherent in using such performance information. Those include, but are not limited to, that actual trading and the associated expenses did not occur, that market conditions change over time, and that no investor had the actual performance presented.
IMPORTANT NOTES:
Index Information:
Any indexes and other financial benchmarks shown are provided for illustrative purposes only, are unmanaged, reflect reinvestment of income and dividends and do not reflect the impact of advisory fees. Investors cannot invest directly in an index. Comparisons to indexes have limitations because indexes have volatility and other material characteristics that may differ from those of Lyrical’s strategies.
The MSCI World Index is an equity index which captures large and mid cap representation across 23 developed market countries around the world. With 1,480 constituents, index covers approximately 85% of the free float-adjusted market capitalization in each country.
The MSCI World Value Index captures large and mid cap securities exhibiting overall value style characteristics across 23 Developed Markets countries around the world. The value investment style characteristics for index construction are defined three variables: book value to price, 12-month forward earnings to price and dividend yield.
The MSCI EAFE Index is an equity index which captures large and mid cap representation across 21 developed market countries around the world, excluding the US and Canada. With 918 constituents, the index covers approximately 85% of the free float-adjusted market capitalization in each country.
The S&P 500® is widely regarded as the best single gauge of large-cap U.S. equities. The index includes 500 leading companies and covers approximately 80% of available market capitalization.
EPS and Multiple Changes
The charts showing change in earnings per share depict the historical change of earnings per share of the companies comprising the LAM Global portfolio as of December 31, 2023 using composite share holdings as of that date. These charts also show the change in earnings per share of the MSCI World Index and the MSCI World Value Index over the same periods. Earnings per share is computed using consensus earnings data, which include certain adjustments from reported, GAAP earnings. Periods marked with an “E” include estimated earnings per share. LAM Global portfolio holdings are included from the earliest date of their available data.