2023 was another good year for Lyrical. Our CS composite returned 27.2%, outperforming the S&P 500 by 90 bps. It was a particularly difficult year to outperform given the outsized performance contribution of the Magnificent Seven mega-cap growth stocks. We, as value investors, do not own any of the Magnificent Seven, but fortunately we did own other strong performers that more than made up for it. 2023 is now the third calendar year in a row our CS composite has outperformed the S&P 500.
Compared to our style benchmark of the S&P 500 Value, it was an even better year. Our CS composite soundly outperformed it by 500 bps, even though that index also greatly benefited from mega-cap growth stocks. Compared with other value indices that were more style-pure, our outperformance margin was even wider. In 2023, we outperformed the U.S. large-cap value indices from Russell, MSCI, and FT Wilshire by more than 1,500 bps.
After a year of such strong returns, it is natural for investors to be concerned about valuation. With the S&P 500 forward P/E at nearly 20x at year-end, we share that valuation concern about the market, but with our CS composite at just 11x, we have no valuation concerns about our own portfolio. In fact, we continue to see significant upside potential.
THREE YEARS IN A ROW
Lyrical’s CS composite has outperformed the S&P 500 in each of the last three calendar years. As you can see in the graph below, in 2021 we outperformed by 230 bps, in 2022 by 90 bps, and now in 2023 by 90 bps again.
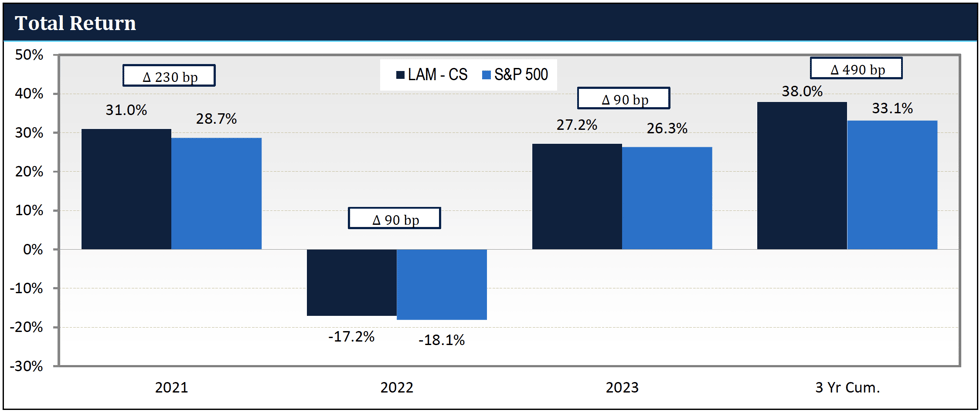
Source: FactSet, Lyrical Analytics
THE MAGNIFICENT SEVEN
The Magnificent Seven is the popular nickname for the seven mega-cap growth stocks that drove much of the returns of the S&P 500 in 2023. Specifically, the seven are: Microsoft, Apple, NVIDIA, Amazon, Meta, Tesla, and Alphabet.
We have not owned any of the Magnificent Seven, which makes sense given that we are disciplined value investors. As you can see by the P/Es in the table below, these stocks do not fit in the value category. The priciest of the seven are Tesla at over 70x forward earnings and Amazon at 44x. Microsoft and Apple have P/Es in the 30s, and NVIDIA and Alphabet have P/Es in the 20s. META at 17x is the only one with a P/E below the S&P 500’s, but it is still more than 50% pricier than our CS Composite P/E of 11x.
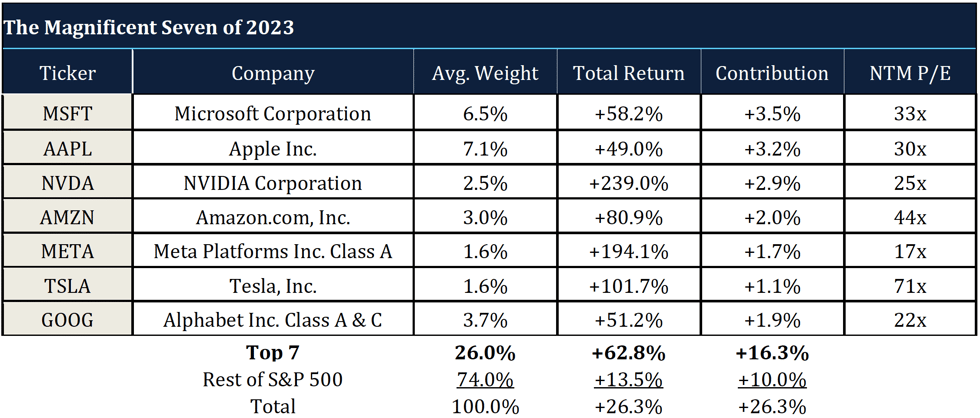
Source: FactSet
While we have seen FANG stocks propel the S&P 500 over the last decade, their impact on the return of the S&P 500 in any of those years pales in comparison to what the Magnificent Seven did in 2023. With a weighted average return of 62.8% and a combined average index weight of 26%, these seven stocks contributed an astounding 16.3 percentage points of the 26.3% index return.
The rest of the S&P 500, what we call the “S&P 493,” returned 13.5%, which is nearly 50 percentage points lower. (Note: the S&P 493 return is very close to the 13.9% return of the S&P 500 Equal Weight index.)
While our CS composite outperformed the full S&P 500 by just 90 bps, it outperformed the S&P 493 by 1,370 bps, and the S&P 500 Equal Weight by 1,330 bps.
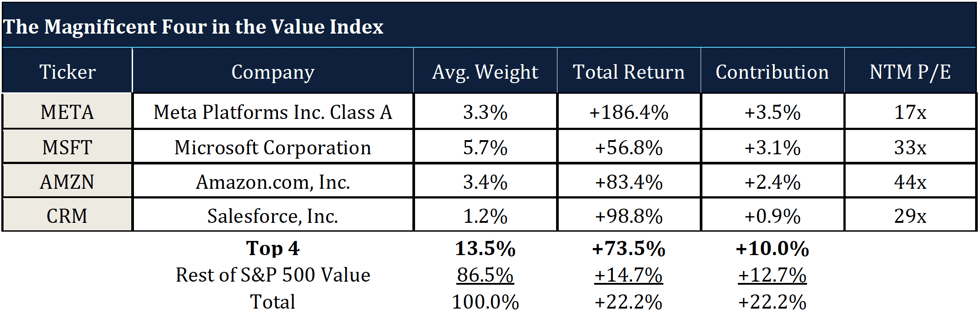
GROWTH STOCKS IN THE VALUE INDEX
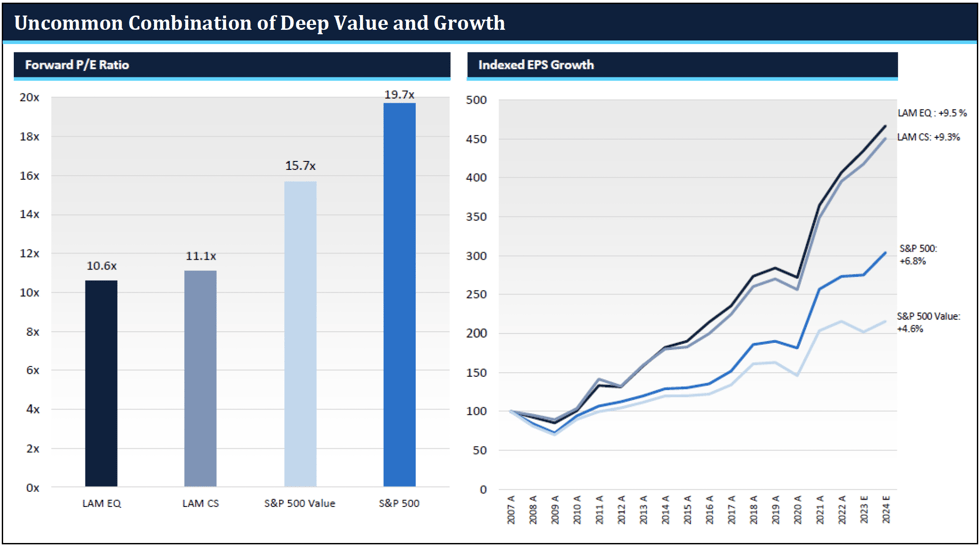
OUR UNCOMMON COMBINATION
 Source: FactSet, See Notes below.
VALUATION SPREAD STILL EXTREMELY WIDE
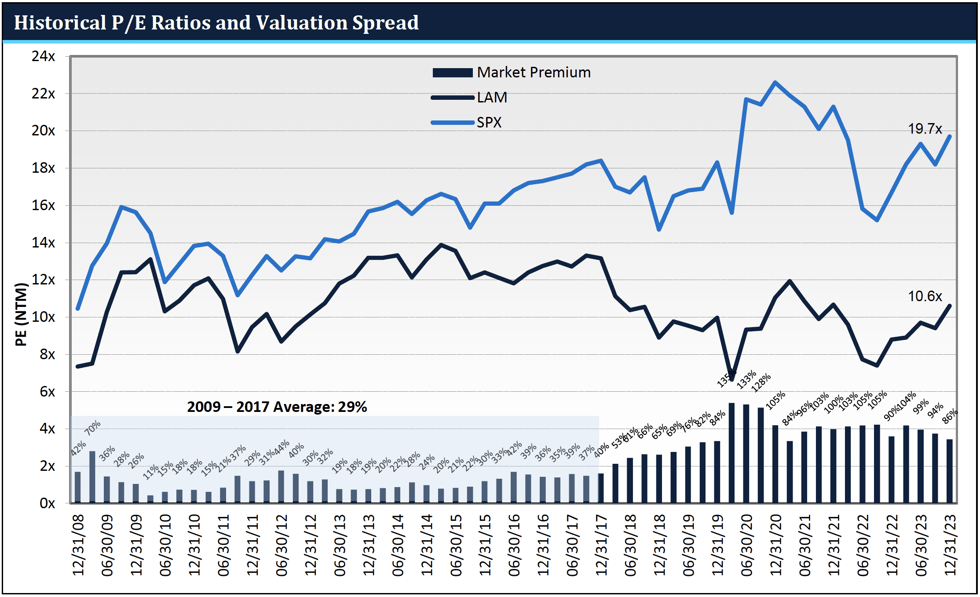
The S&P 500 ended 2023 with a forward P/E of 19.7x, which is more than 25% above its 15-year average. By contrast, our CS composite forward P/E is not above, but actually slightly below our 15-year average.
Presented on the graph below are our current and historical portfolio P/E ratios and the P/E of the S&P 500, with the bars at the bottom showing the valuation spread between the two. (Note: In this graph we use our EQ composite which has a longer history than CS). The valuation spread of our portfolio relative to the S&P 500 remains extremely wide at 86%, and it is over 90% pro-forma for our recent exit of Broadcom.
 Source: FactSet
CONCLUSION
Overall, 2023 was a very good year. Our CS composite generated strong absolute returns of 27.2%, which outperformed the S&P 500 by 90 bps and our style benchmark of the S&P 500 Value by 500 bps. We achieved this outperformance despite not owning any of the Magnificent Seven growth stocks that significantly boosted the returns of both those indices. Excluding the impact of those mega-cap growth stocks would increase our outperformance to 1,370 bps vs. the S&P 500 and 1,250 bps vs. the S&P 500 Value.
While it is sensible to have valuation concerns about the S&P 500, we have no such concerns about our own portfolio, as our portfolio P/E is slightly below our 15-year average. We believe we own a great collection of resilient, growing companies at deeply discounted valuations, and thus continue to see significant upside potential.
The valuation spread between our portfolio and the S&P 500 remains extremely wide at 86% (90%+ proforma for our recent exit of Broadcom). At some point, we expect that spread to revert to where it was in the past, and in the process drive substantial outperformance.
THE S&P 500® IS WIDELY REGARDED AS THE BEST SINGLE GAUGE OF LARGE-CAP U.S. EQUITIES. THE INDEX THE INDEX INCLUDES 500 LEADING COMPANIES AND COVERS APPROXIMATELY 80% OF AVAILABLE MARKET CAPITALIZATION.
THE S&P 500® VALUE DRAWS CONSTITUENTS FROM THE S&P 500®. S&P MEASURES VALUE USING THREE FACTORS: THE RATIO OF BOOK VALUE, EARNINGS, AND SALES TO PRICE. S&P STYLE INDICES DIVIDE THE COMPLETE MARKET CAPITALIZATION OF EACH PARENT INDEX INTO GROWTH AND VALUE SEGMENTS.
NOTES:
ALL MARKET DATA IS COURTESY OF FACTSET. INDEXED EPS GROWTH DEPICTS THE HISTORICAL CHANGE IN EARNINGS PER SHARE OF THE COMPANIES IN THE LAM U.S. VALUE EQUITY STRATEGIES USING WEIGHTS IN THE LAM-EQ COMPOSITE AS OF DECEMBER 31, 2022. ACTUAL HOLDINGS, AND THEIR WEIGHTS, VARIED OVER TIME. EARNINGS PER SHARE IS COMPUTED USING CONSENSUS EARNINGS DATA PER FACTSET, WHICH INCLUDE CERTAIN ADJUSTMENTS FROM REPORTED, GAAP EARNINGS. PERIODS MARKED WITH AN “E” INCLUDE ESTIMATED EARNINGS PER SHARE. THE HISTORICAL PORTFOLIO P/E (NTM) CHART COMPARES THE WEIGHTED AVERAGE NEXT TWELVE MONTHS P/E RATIOS AS OF THE BEGINNING OF EACH QUARTER FOR THE LAM-EQ COMPOSITE AND THE S&P 500 INDEX. ACTUAL BEGINNING OF QUARTER LAM-EQ COMPOSITE WEIGHTS ARE USED.