Value stocks have a long history of delivering market-beating returns. But how you get your Value exposure is a critical decision. For large-cap value, it is tempting to get exposure through low-cost passive products. However, these products have a serious problem: they track the large-cap value indices, and you don’t want to get your value from an index.
VALUE STOCKS vs. VALUE INDEX
Over the decades, value stocks have handily outperformed the S&P 500. Since 1979 when S&P created their value and growth style indices, the cheapest stocks have outperformed the S&P 500 by nearly 400 bp per annum.
The graph below tells the story. The dark blue line plots the cumulative return of the cheapest quintile of our investment universe of the top 1000 stocks. Specifically, we sort that universe by valuation and then calculate the return of investing in an equal-weighted portfolio of the cheapest quintile, with quarterly reconstruction.
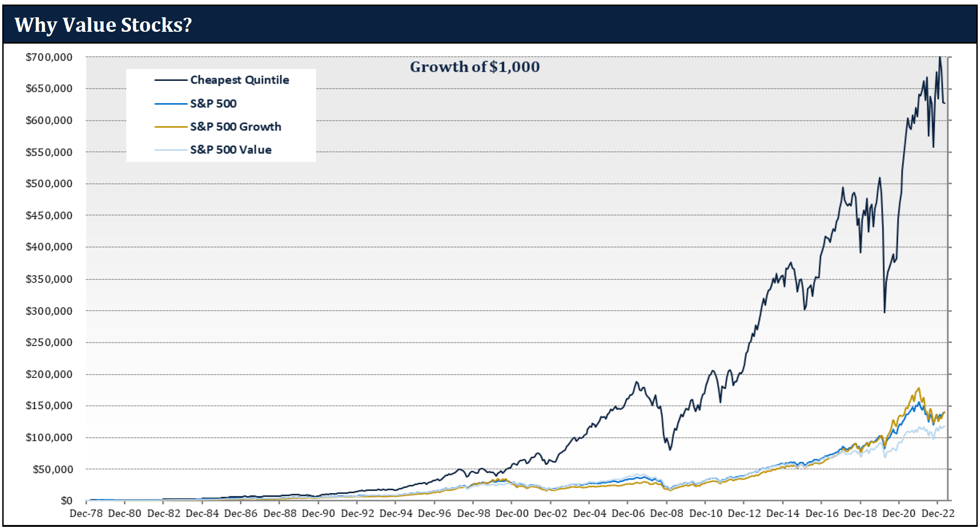
Below the returns of the cheapest quintile, you can see the lower historical performance of the S&P 500 and its Value and Growth style indices. Notice the pale blue line at the bottom, which is the S&P 500 Value index. Amazingly, over this 40+ year period when the cheapest stocks outperformed by so much, the worst performing S&P style index was their Value index. This is why you don’t want to get your value from an index.
HOW MANY STOCKS ARE IN THE VALUE INDEX?!?
Why is the large-cap value index so bad?
One of the reasons is the huge number of stocks in the index. When S&P divides the S&P 500 into Value and Growth, it seeks to put half the cumulative market cap in each. Since many of the largest market cap companies fall into the growth index, they must put many more stocks into the value index to balance it out. Furthermore, by their methodology, some stocks are partially allocated to both the value and growth indices. As a result of this approach, there is an enormous number of holdings in their large-cap value index. In fact, more than 80% of the S&P 500 constituents are in the S&P 500 Value!
This means that the S&P 500 Value is not a value index concentrated in the cheapest stocks. Rather, it is more of a core index that owns everything except some of the most expensive stocks. To the extent that the cheapest stocks are in that index, their returns are diluted by the hundreds of other stocks also in that index. This is not just an S&P issue, as other popular "value" indexes follow similar methodologies.
ERROR OF TRACKING
It is not just the passive products you have to worry about. If you don’t want to get your value from the index, you need to avoid many active products, too.
Many active large-cap value products are managed for a low tracking error to the value indices. Given the flawed construction and poor historical performance of the value index, the last thing you want to do is track it. In large-cap value, low tracking error is a liability, not an asset.
DON’Ts AND DOs
Large-cap value stocks have a long history of delivering market-beating returns. Unfortunately, getting access to these returns requires some homework. The large-cap value indices, and the passive and active products that track them, have been poor proxies for value stock returns.
You don’t want to get your value from an index. Instead, we suggest you look for value managers that are focused on value, not the index. Doing so, by necessity, will mean high active share and high tracking error, but that should be okay. Why would you want to look like or track the value index, given its disappointing history?
Good fundamental value managers still exist, although they are increasingly rare. May we suggest you start by looking at Lyrical Asset Management.
For the period from January 1960 – December 1984 we use Sanford Bernstein data for the cheapest quintile within the 1,000 largest U.S. stocks by market capitalization based on price to book value as the representative cheapest quintile.
For the period from January 1985 – December 1997 for each quarter, based on FactSet data, we divided the 1,000 largest U.S. stocks by market capitalization into quintiles based on their beginning of quarter price to median trailing earnings multiple. Return for the lowest p/e quintile is the simple average of the total returns, including dividends, of each stock in that quintile. Returns for stocks that ceased trading are included through the date they ceased trading.
For all periods after 1997, for each calendar quarter, based on FactSet data, we divided the 1,000 largest U.S. stocks by market capitalization into quintiles based on their beginning of quarter price to median forward earnings multiple. Return for each quintile is the simple average of the total returns, including dividends, of each stock in that quintile. Returns for stocks that ceased trading are included through the date they ceased trading. The universe average is the simple average total return of the 1,000 stocks over the period presented.