The simplest way to summarize our investment approach is that we seek to own the gems amid the junk. It is all about getting more for less. More quality and earnings growth for lower valuations.
To our core, we are value investors. We seek to own the cheapest stocks in our universe, because the cheapest stocks historically have had the highest returns. Incredibly, in the U.S. the cheapest stocks have outperformed the S&P 500 by nearly 400 bps per annum over the last 40+ years. Over that same period, the cheapest stocks outside the U.S. did even better, and outperformed the MSCI EAFE by over 400 bps per annum.
While cheap stocks have been strong performers, they are often junky companies with low quality characteristics and low earnings growth. Despite these weaker fundamentals, the cheapest stocks still have outperformed over most time periods, and by a wide margin.
This counterintuitive outperformance is driven by the cheap stocks being too cheap. Yes, most of these stocks deserve lower valuation multiples than the rest of the market, but they are so unpopular that their multiples become too low. Over time, these stocks see their multiples expand from “too low” to appropriately low, and that expansion is what has driven their strong performance.
While most of the cheapest stocks are junk, within that junkyard there are gems waiting to be discovered. These gems are companies that have the quality and growth characteristics of pricier stocks, yet their valuations are in line with the cheapest stocks. Undeniably, these gems are rare exceptions that take effort and skill to discover, but they do exist. Given that the cheap junk has outperformed over time, we expect these cheap gems to outperform by even more.
By owning the gems amid the junk, we have built portfolios with the uncommon combination of both deep value and quality growth characteristics. This combination is quantifiable and demonstrates our investment proposition relative to our peers. Compared to most of our peer group, especially those that closely track the value benchmarks, our portfolio not only has a lower P/E valuation, but also a superior earnings growth profile.
Finding gems amid the junk. Getting more for less. That is our formula for success.
WHY LOOK FOR GEMS AMID THE JUNK?
Why look for gems amid the junk? Wouldn’t it be easier to look for gems amid, say, the gems?
Of course, it is easier to find gems amid the pricier stocks in the market, but historically the pricier stocks have had lower returns. If we want to select from the stocks with the highest historical returns, then we must sift through the junk.
The cheapest stocks may not be the best companies, but they have historically produced the best returns. You can see the magnitude of this historical outperformance on the graph below. The dark blue line plots the cumulative return of the cheapest quintile of our U.S. investment universe. Specifically, we start with the 1,000 largest U.S. stocks and sort them by valuation and then calculate the return of investing in an equal-weighted portfolio of the cheapest quintile, with quarterly reconstruction.
The time series here is over 40 years long and begins in 1979, which is when Standard & Poor’s first launched their Value and Growth style indices. Below the returns of the cheapest quintile, you can see the lower historical performance of the S&P 500 and its Value and Growth style indices.
 Source: FactSet. See Important Notes.
Over this 40+ year period, the cheapest quintile has outperformed the S&P 500 index by nearly 400 bps per annum. So, if you want to own stocks that have had the highest returns, the cheapest quintile is where to go.
(It is also interesting to note that over this 40+ year period, the worst performing S&P style Index was their Value index, which is the pale blue line at the bottom. This is why we say, “don’t get value from an index.”)
BETTER STOCKS, WORSE COMPANIES
As the old saying goes, “there ain’t no such thing as a free lunch.” While the cheapest quintile has produced higher returns, it has not been easy to own those companies. Whether you look at quality measures like ROIC, or earnings growth, the cheapest quintile, both in the U.S and internationally, is clearly worse than the rest of the market.
 Source: FactSet.
That said, while the cheapest quintile is lower quality and lower growth on average, there are rare exceptions of good companies with good growth profiles that can be found there. We call these the gems amid the junk.
AN UNCOMMON COMBINATION
Equity markets are mostly efficient, and it is fair to be skeptical about the existence of gems amid the junk. Surely, if these companies were truly gems, they should not be valued as cheaply as junk.
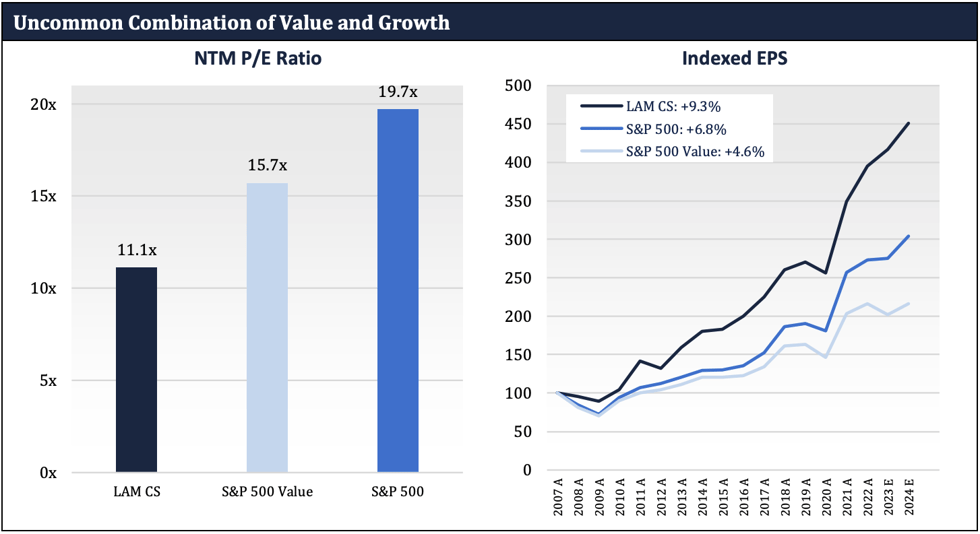
Our portfolio characteristics should help overcome that skepticism. The numbers show our portfolio has an uncommon combination of both deep value and quality growth. Below, in the bar graph on the left, you can see the average forward P/E ratio of our U.S. portfolio is far lower than that of the S&P 500 and the S&P 500 Value.
While our portfolio valuation ranks in the cheapest quintile, it also has an attractive growth profile. Not only is our portfolio EPS growth better than our value peers but is also better than the much pricier S&P 500. Below, in the line graph on the right, you can see that the historical EPS growth profile of our U.S. portfolio is better than that of the S&P 500 and S&P 500 Value and that EPS has been less volatile, too.
You will find this same uncommon combination of value and growth in our Global and International portfolios, as well.
 Source: FactSet.
We have not found another product that matches our combination of value and growth. There are other deep value products with a similar, or perhaps lower P/E, but they do not match our attractive growth profile. There are also GARP style products with similar, or perhaps better earnings growth, but they do not match our valuation. That said, most of our peer group, especially the majority that closely track the benchmarks, look worse than us on both metrics, with both higher valuation and lower earnings growth.
THE LYRICAL WAY IS VQA
To achieve this uncommon combination of value and growth, we build our portfolios with a process we call VQA, which stands for Value, Quality, and Analyzability.
Throughout our careers we have owned hundreds of cheap stocks. Many of these stocks were successful investments, driving our track record of returns. But many also failed, despite their cheap valuation. What has separated the winners from the losers was the future earnings of the companies. When the future earnings were within our large margin of safety, the stocks were eventually successful. However, when the future earnings significantly underachieved beyond our margin of safety, valuation was not enough. Thus, the key to investment success is not just Value and buying cheap stocks, but also avoiding earnings disasters. When we add the criteria of Quality and Analyzability, we greatly reduce the occurrence of those earnings disasters.
We always start with Value, because even if the future earnings deliver as expected, if the purchase price is too high, the investment outcome will disappoint. Price matters.
Once we have Value, we want to focus on getting the earnings right. Our next step is to look at Quality. In our experience, our earnings models were more likely to be correct when we avoided the lowest quality companies. Good companies have been easier to get right than bad companies. Thus, we have a minimum ROIC threshold that all our companies must exceed. If a company does not exceed this threshold, we will not own it, no matter how cheap the stock appears. Some of the lower quality areas that we routinely avoid include commodities, deep cyclicals, and utilities.
To pull it all together, you can think of Value + Quality as being the gems amid the junk. But there is another critical element to our investment approach that we call Analyzability. In our experience, our earnings models were more likely to be correct when we analyzed simpler businesses. There are no style points in investing, and you do not get awarded extra return just because a company is excessively complicated or is in the middle of turmoil. To get the earnings right, we have a strong investment team that performs deep research and analysis on every investment. But perhaps as important as that is we target stocks that are more analyzable, and therefore easier to get right. These easier stocks are harder to find but are more likely to have a successful outcome. Some of the low analyzability areas that we routinely avoid include banks, pharma and biotech, and companies experiencing disruption like store-based retailers.
CONCLUSION
The cheapest stocks have a long history of delivering the highest returns, both in the U.S. and international markets, but most of these companies can be difficult to stomach. The cheapest stocks on average are junk, with lower quality and lower growth. Yet, despite these weaker fundamentals, the cheapest stocks have still outperformed over most time periods, and by a wide margin.
Most, but not all cheap stocks are junk. We have found that within the junk there are rare gems. These gems are companies with the quality and growth characteristics of much pricier stocks, yet valuations like the junk. Given that the cheap junk outperforms over time, we expect these cheap gems to outperform by even more.
Lyrical’s approach is all about finding these gems amid the junk, and in so doing, getting more for less. More quality and earnings growth for lower valuation. That is our formula for success.
IMPORTANT NOTES:
Past performance is not necessarily indicative of future results.
Please see the Notes & Disclaimers tab at lyricalam.com for a discussion of certain material risks of an investment in Lyrical’s strategies.
This document is confidential and does not convey any offering or the solicitation of any offer to invest in the strategy presented. Any such offering can only be made following a one-on-one presentation, and only to qualified investors in those jurisdictions where permitted by law. The information included in this document is not being provided in a fiduciary capacity, and it is not intended to be, and should not be considered as, impartial advice. “Forward-looking statements” contained herein can be identified by the use of forward-looking terminology such as “may,” “will,” “should,” “expect,” “anticipate,” “project,” “estimate,” “intend,” “continue,” or “believe,” or the negatives thereof or other variations thereon or comparable terminology. Due to various risks and uncertainties, actual events, results or actual performance may differ materially from those reflected or contemplated in such forward-looking statements. Nothing contained herein may be relied upon as a guarantee, promise, or assurance or as a representation as to the future.
Certain information contained herein has been obtained from third party sources and not independently verified by Lyrical. No representation, warranty, or undertaking, expressed or implied, is given to the accuracy or completeness of such information. While such sources are believed to be reliable, Lyrical does not assume any responsibility for the accuracy or completeness of such information. Lyrical does not undertake any obligation to update the information contained herein as of any future date.
Why Value? Graph and Quality and Growth by US Valuation Quintile Charts
Cheapest Quintile:
For the period from January 1960 – December 1984 we use Sanford Bernstein data for the cheapest quintile within the 1,000 largest U.S. stocks by market capitalization based on price to book value as the representative cheapest quintile.
For the period from January 1985 – December 1997 for each quarter, based on FactSet data, we divided the 1,000 largest U.S. stocks by market capitalization into quintiles based on their beginning of quarter price to median trailing earnings multiple. Return for the lowest p/e quintile is the simple average of the total returns, including dividends, of each stock in that quintile. Returns for stocks that ceased trading are included through the date they ceased trading.
For all periods after 1997, for each calendar quarter, based on FactSet data, we divided the 1,000 largest U.S. stocks by market capitalization into quintiles based on their beginning of quarter price to median forward earnings multiple. Return for each quintile is the simple average of the total returns, including dividends, of each stock in that quintile. Returns for stocks that ceased trading are included through the date they ceased trading. The universe average is the simple average total return of the 1,000 stocks over the period presented.
This does not reflect the experience of any investor.
The S&P 500 Index is a market capitalization weighted index comprised of 500 widely-held common stocks.
The S&P 500 Value Index measures the performance of the large cap value segment of the U.S. equity universe. It includes those S&P 500 companies with lower price to book ratios and lower expected growth values. The S&P 500 Value Index is constructed to provide a comprehensive and unbiased barometer of the large cap value segment. The index is completely reconstituted annually to ensure new and growing equities are included and that the represented companies continue to reflect value characteristics.
The S&P 500 Growth Index measures the performance of the large cap growth segment of the U.S. equity universe. It includes those S&P 500 companies with higher sales growth, ratio of earnings change to price, and momentum. The S&P 500 Value Index is constructed to provide a comprehensive and unbiased barometer of the large cap growth segment. The index is completely reconstituted annually to ensure new and growing equities are included and that the represented companies continue to reflect value characteristics.
The MSCI EAFE Index is an equity index which captures large and mid cap representation across 21 developed market countries around the world, excluding the US and Canada. With 918 constituents, the index covers approximately 85% of the free float-adjusted market capitalization in each country.
Indexed EPS Growth Chart
This chart depicts the historical change of earnings per share of the companies in the LAM U.S. Value CS strategy as of June 30, 2023, using current composite shares as of June 30, 2023, and the change in earnings per share of the S&P 500 Index over the same period. Actual shares of such holdings varied over time. Earnings per share is computed using consensus earnings data per FactSet, which include certain adjustments from reported, GAAP earnings. Periods marked with an “E” include estimated earnings per share.