We often are asked what the right size and style box is for our U.S. portfolio. From a style perspective we are clearly deep on the value side of the spectrum. Less clear is where we fit from a size perspective.
As of year-end 2022*, the average market capitalization of our capitalization-scaled (LAM-CS) portfolio construction was $37 billion. This appears significantly smaller than the $234 billion of the S&P 500 Value index or the $151 billion of the S&P 900 Value index. On the other hand, it is significantly larger than the $5.8 billion of the S&P Midcap 400 Value index. So, where should investors place Lyrical? Large Value or Mid Value?
For nearly all our clients, they place us in the large-cap value box, mainly because our portfolio closely resembles the constituents of the S&P 500 Value and S&P 900 Value, once you eliminate the gross distortion of cap weighting.
CAPITALIZATION WEIGHTING DISTORTION
S&P capitalization weights their indices, meaning the larger the market cap, the larger the weight in the index. This causes the average market cap of the S&P 500 Value and S&P 900 Value indices to be a grossly distorted picture of their constituents.
In the stock market, the distribution of market caps follows what is known in mathematics as a “power law.” The largest stock in the market has a gigantic market cap, and it falls rapidly as you move to the second, third, fourth largest stocks, etc. Quickly, the curve flattens as the pace of decline dramatically levels off. Below is a chart of the top 100 stocks by market cap in the U.S. market at year-end 2022.
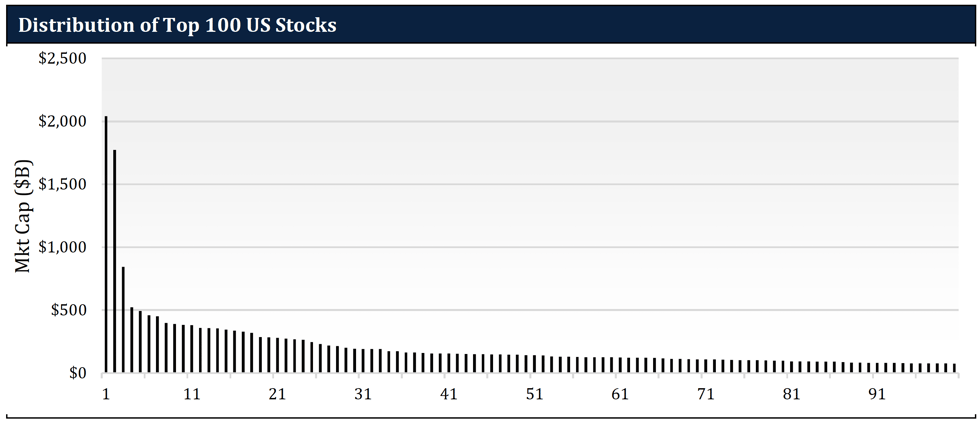
The largest stock at year-end 2022 was Apple at $2,041 billion. It was 15% bigger than the second largest stock, Microsoft at $1,772 billion, and 110% bigger than the third largest stock, Amazon at $844 billion. By the time you get to the fourth largest stock, Alphabet, market cap has declined by 74% to $521 billion, and at the 100th largest stock it has declined by 96% to about $75 billion.
One consequence of capitalization weighting is that the index does not have material exposure to most of its constituents, as most of the exposure is in a few of the largest names. For example, there are 407 constituents in the S&P 500 Value, but 21.7% of the exposure is in the ten largest stocks. The other 78% is spread over the remaining 397. The broader S&P 900 Value has 740 constituents, yet the top ten stocks still dominate with a 17.9% exposure. So, you may think you are getting broad exposure to the large-cap value universe, but you’re really not.
Another consequence of cap weighting is that it grossly distorts the weighted average market cap of the index. The S&P 500 Value has an average market cap of $234 billion. Amazingly, there are only 25 stocks in the entire U.S. market that size or bigger. On the other hand, if we take the same index and equal weight it, the average market cap is $55 billion, a 76% reduction, even though it is all the same stocks.
Similarly, the S&P 900 Value has an average market cap of $151 billion with only 43 stocks in the entire U.S. market being that size or bigger. When one equally weights that index, the average market capitalization is $35 billion, a 77% reduction.
LYRICAL LOOKS LIKE LARGE CAP
Looking at Lyrical’s portfolio, it is clear to us that large cap is the most appropriate category. While we appear to be much smaller than the cap weighted averages of the S&P 500 and S&P 900 Value indices, we are very much in-line with the equal weighted average of these same indices. Our LAM-CS composite has an average market cap of $37.5 billion, right between the $55.5 and $34.9 billion of an equal-weighted S&P 500 Value and S&P 900 Value.

Given our average cap is much lower than the cap-weighted indices, some question whether we belong in the mid-cap category. As you can see on the chart above, we don’t fit mid-cap very well, as it is dramatically smaller than our average cap. In fact, our average market cap is more than sixfold bigger than the $5.8 billion of the S&P Midcap 400 Value.
A DISTINCTION WITHOUT A DIFFERENCE
The debate about S&P 500 Value versus S&P 900 Value, or large-cap versus mid-cap is mostly about distinctions without a difference. When institutional investors allocate to a style box, they want to make sure they are getting the characteristics of that style. While the average market caps change dramatically from S&P 500 to S&P 900, or from cap weighting to equal weighting, the performance characteristics do not change much.
Firstly, the S&P 500 Value and S&P 900 Value have basically the same return stream. Since Lyrical’s inception in 2009, the returns of the S&P 500 Value have correlated 99.97% to the S&P 900 Value.
Moving from cap-weighting to equal-weighting makes a slightly bigger difference, but that difference is still small. Since 2009, the returns of the cap-weighted S&P 500 Value have correlated 98.5% with an equal-weighted S&P 500 Value, and the returns of the cap-weighted S&P 900 Value have correlated 96.0% with an equal-weighted S&P 900 Value. These are all very high correlations.
Lastly, even the difference between the cap-weighted large-cap and mid-cap is not that different. Since 2009, the returns of the S&P 500 Value and S&P Midcap 400 Value have been 95.7% correlated. Again, very high correlation.
THERE IS ONE KEY DIFFERENCE: RETURNS
While the correlations between the standard indices, their equal-weighted versions, and their mid-cap relatives have been very high, the returns themselves have been materially different. Historically, the value stocks with the largest market caps have been underperformers, making the cap-weighted large-cap value indices the worst performing indices of this group.
In the chart below we present, for of all the indices we have referenced, the returns over Lyrical’s history of 2009 through 2022. The two worst performing indices in this chart are the cap-weighted S&P 500 Value and S&P 900 Value.
Interestingly, these indices did not pick the wrong stocks, just the wrong weights. The two best performing indices are the equal-weighted versions of those same indices! Equal weighting improved the returns of the S&P 500 Value by 180 bps per annum, and the S&P 900 Value by 150 bps per annum.
This was not a “small-cap” effect, as you can see these equal-weighted large-cap indices outperformed the smaller cap indices of the S&P MidCap 400 Value and S&P SmallCap 600 Value.

Source: FactSet
CONCLUSION
Once you look past the gross distortions of market-cap weighting, it becomes clearer that Lyrical best fits in the large-cap value category. Our true best fit would be for equal-weight large cap value, though we have never actually met anyone that uses that classification. While not as good a fit, some clients have used us for mid-cap or all-cap mandates. Given the high correlation between large-cap and mid-cap, this is not a bad fit, even as our market-cap profile is significantly larger than that of the mid-cap benchmark.
We also have been used as a satellite manager in a core-satellite approach, and some clients have placed us in special buckets they have for differentiated high active share or opportunistic strategies.
The question of large-cap or mid-cap arises because we have a lower average market cap than the cap-weighted large-cap indices, but if you know where the better returns have been, this has clearly been an advantage, not a drawback.
There is also the issue of correlation and tracking error. Given the high correlation between the cap-weighted large cap indices and their equal-weighted versions, or even their mid-cap counterparts, portfolio average market cap should not be a concern. However, at Lyrical we construct concentrated portfolios with very high active share. Whatever our average market cap, we are going to have high tracking error relative to these benchmarks. Again, we think this is an advantage, not a drawback. If you want these indices, they are available through cheap passive options. But if you are looking to outperform these indices, that is not going to happen without a portfolio that looks markedly different than those indices.
Indexes are provided for illustrative purposes only, are unmanaged, reflect reinvestment of income and dividends and do not reflect the impact of advisory fees. Investors cannot invest directly in an index. Comparisons to indexes have limitations because indexes have volatility and other material characteristics that may differ from those of Lyrical’s strategies.
S&P Dow Jones Indices measure value stocks using three factors: the ratios of book value, earnings, and sales to price. S&P Style Indices divide the complete market capitalization of each parent index into growth and value segments. Constituents of the S&P 500 Value® are drawn from the S&P 500®. Constituents of the S&P 900 Value® are drawn from the S&P 900®, which combines the S&P 500® and S&P MidCap 400®. Constituents of the S&P SmallCap600 Pure Value® are drawn from S&P SmallCap 600®.
The S&P MidCap 400® provides investors with a benchmark for mid-sized companies. The index, which is distinct from the large-cap S&P 500®, is designed to measure the performance of 400 mid-sized companies, reflecting the distinctive risk and return characteristics of this market segment.
Using FactSet data, we present the equal-weighted data for the S&P 900 Value® and the S&P 500 Value®.