2023 was a challenging year for impact and sustainable investment strategies. The MSCI ACWI Sustainable Impact Index underperformed the MSCI World Index by about 2,000 bps. This poor performance was tied to severe multiple compression in several high valuation stocks with obviously impactful businesses. Since impact can be hard to find, the largest impact funds tend to crowd into the same obviously impactful businesses and therefore suffered similar performance woes as the index. Startlingly, 25 stocks are commonly owned by at least one-third of the 15 largest actively managed “Sustainable” or “Impact” funds, according to eVestment. In Lyrical’s Global Impact Value Equity Strategy (GIVES), we do not own any of those obvious impact stocks and we avoided much of the performance pain suffered in 2023.
There is a lot to like about obviously impactful businesses; not only do they improve the world, they also typically benefit from secular growth. However, overpaying for any business, even an impactful one, should eventually lead to poor returns. We believe prime examples of this are the popular and expensive alternative energy companies, including Enphase and SolarEdge.
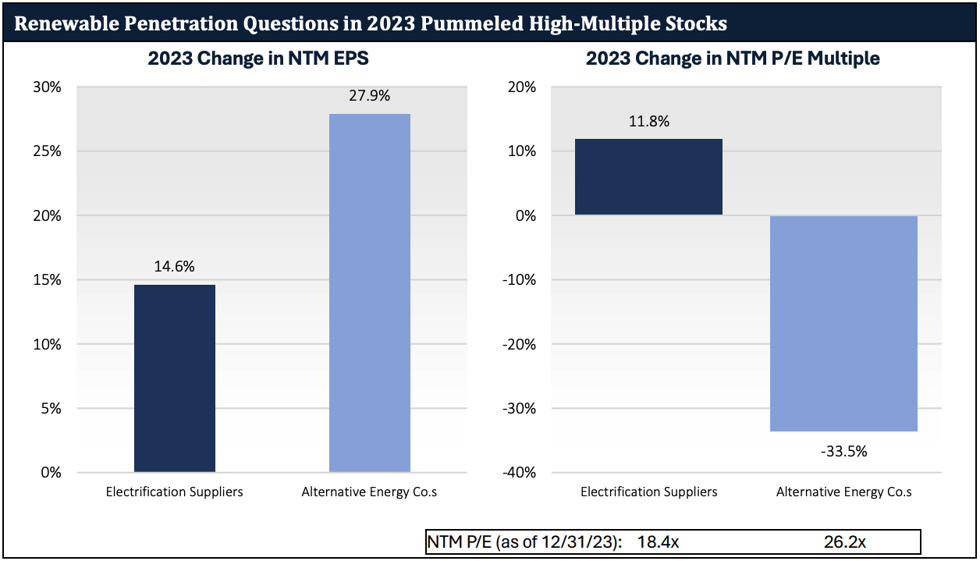
The alternative energy companies had attractive fundamentals, but they were expensive. In 2023, these companies had fantastic earnings growth of 28%, handily beating the 15% growth of the electrification suppliers, as you can see on the left side of the chart below. However, the alternative energy companies had an average return of -14%. Their problem was not growth; it was valuation. As investors questioned the long-term pace of renewables adoption, this group of companies saw a de-rating of -34% in 2023, as you can see on the right side. Even after this multiple decline, these stocks still ended the year at a lofty 26x earnings.
Impact companies can be found without splurging on high valuations. Consider electrical suppliers providing the materials needed to support electrification. Electrical suppliers grew earnings by a strong, albeit slower 15%, but they started the year at a lower valuation, which allowed for multiple expansion of 28% during the year and a positive average return of 32%.
 Electrification Suppliers: ABBN-CH, ETN, FLNC, GE, 6501-JP, HUBB, MTZ, NEX-FR, NKT-DK, NVT, PRI-IT, PWR, SU-FR, SIE-DE, ENR-DE, RXL-FR, WCC, JCI. Alternative Energy Companies: ARRY, BE, BEPC, ENPH, FSLR, GNRC, ITRI, NEP, ORA, SHLS, SEDG, RUN
The electrification suppliers may be less exciting businesses, but we think they are better investments because they have reasonable valuations. In GIVES, we look to benefit from the secular growth available to companies serving the energy transition, but we only invest in companies that are selling at a sizable discount to their intrinsic value. Of all these companies, we own only two of the electrification suppliers, Wesco and Rexel. These companies grew their earnings 16% on average during 2023 and trade for only 10x EPS, a 50% discount to electrification suppliers and a 60% discount to alternative energy companies.
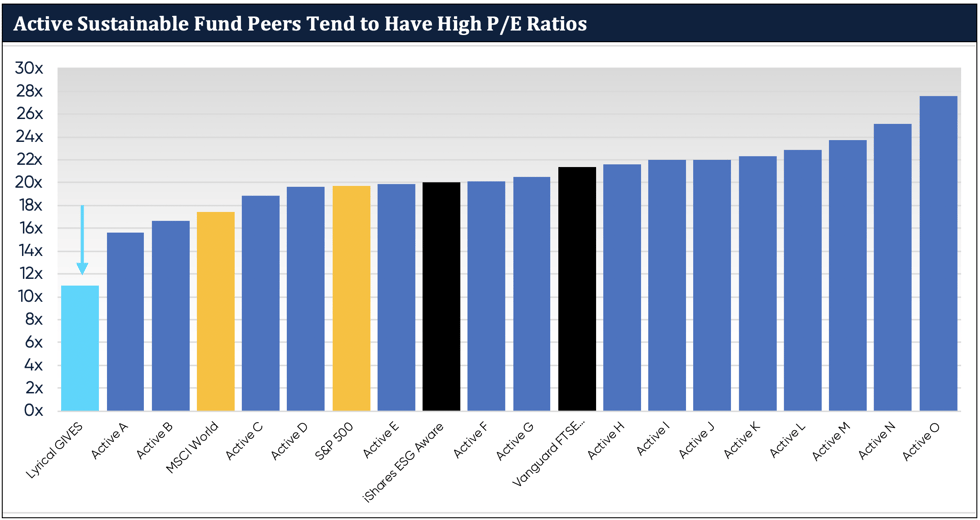
By owning non-obvious impact businesses at attractive valuations, we seek to avoid both the crowding and the expensive valuations of our peers. While our 15 largest peer portfolios trade for above 20x EPS, GIVES trades for 11x as shown below.
 Source: FactSet.
In investing, price matters, and there are no exceptions to this rule for sustainable investing. If you pay too much for an impactful business, you will likely generate a poor return. As value investors we often find ourselves in the unpopular parts of climate change. We call this approach to investing impact in the trenches. We will leave the obvious impact companies with the, to us, obviously unattractive valuations to others, while we focus on less glamorous though critical parts of global decarbonization.
NOTES:
Data is as of December 31, 2023 except where otherwise indicated.
Lyrical disclaims any duty to update historical information included herein, including whether we continue to hold positions that are mentioned.
Specific investments described on this website do not represent all investments by Lyrical. You should not assume that investment decisions we include were or will be profitable. Specific investment advice references are for illustrative purposes only and not necessarily representative of investments that will be made in the future. A list of all prior investment recommendations is available upon request.
Past performance is not necessarily indicative of future results.
Index Information:
Any indexes and other financial benchmarks shown are provided for illustrative purposes only, are unmanaged, reflect reinvestment of income and dividends and do not reflect the impact of advisory fees. Investors cannot invest directly in an index. Comparisons to indexes have limitations because indexes have volatility and other material characteristics that may differ from those of Lyrical’s strategies.
The MSCI ACWI Sustainable Impact Index is designed to identify listed companies whose core business addresses at least one of the world’s social and environmental challenges, as defined by the United Nations Sustainable Development Goals. The Sustainable Impact categories include: nutritious products, treatment of major diseases, sanitary products, education, affordable housing, loans to small and medium size enterprises, alternative energy, energy efficiency, green building, sustainable water, and pollution prevention. To be eligible for inclusion in the Index, companies must generate at least 50% of their sales from one or more of the Sustainable Impact categories and maintain minimum environmental, social and governance (ESG) standards. The parent index is MSCI ACWI. Constituent selection is based on data from MSCI ESG Research.
The MSCI World Index is an equity index which captures large and mid cap representation across 23 developed market countries around the world. With 1,480 constituents, index covers approximately 85% of the free float-adjusted market capitalization in each country.