The Lyrical Challenge is inspired by the old Pepsi Challenge commercials. Starting in 1975, Pepsi began running television ads where they showed ordinary people participating in a blind taste test between two colas: Pepsi and Coke. At Lyrical, we do our own blind test, but of stocks instead of colas, and of earnings records and valuation multiples instead of taste. The results of these blind comparisons can be surprising, as the perception of a stock can be very different from the reality. In this piece, we present one of the more interesting Lyrical Challenges we have encountered.
THE FAVORITE
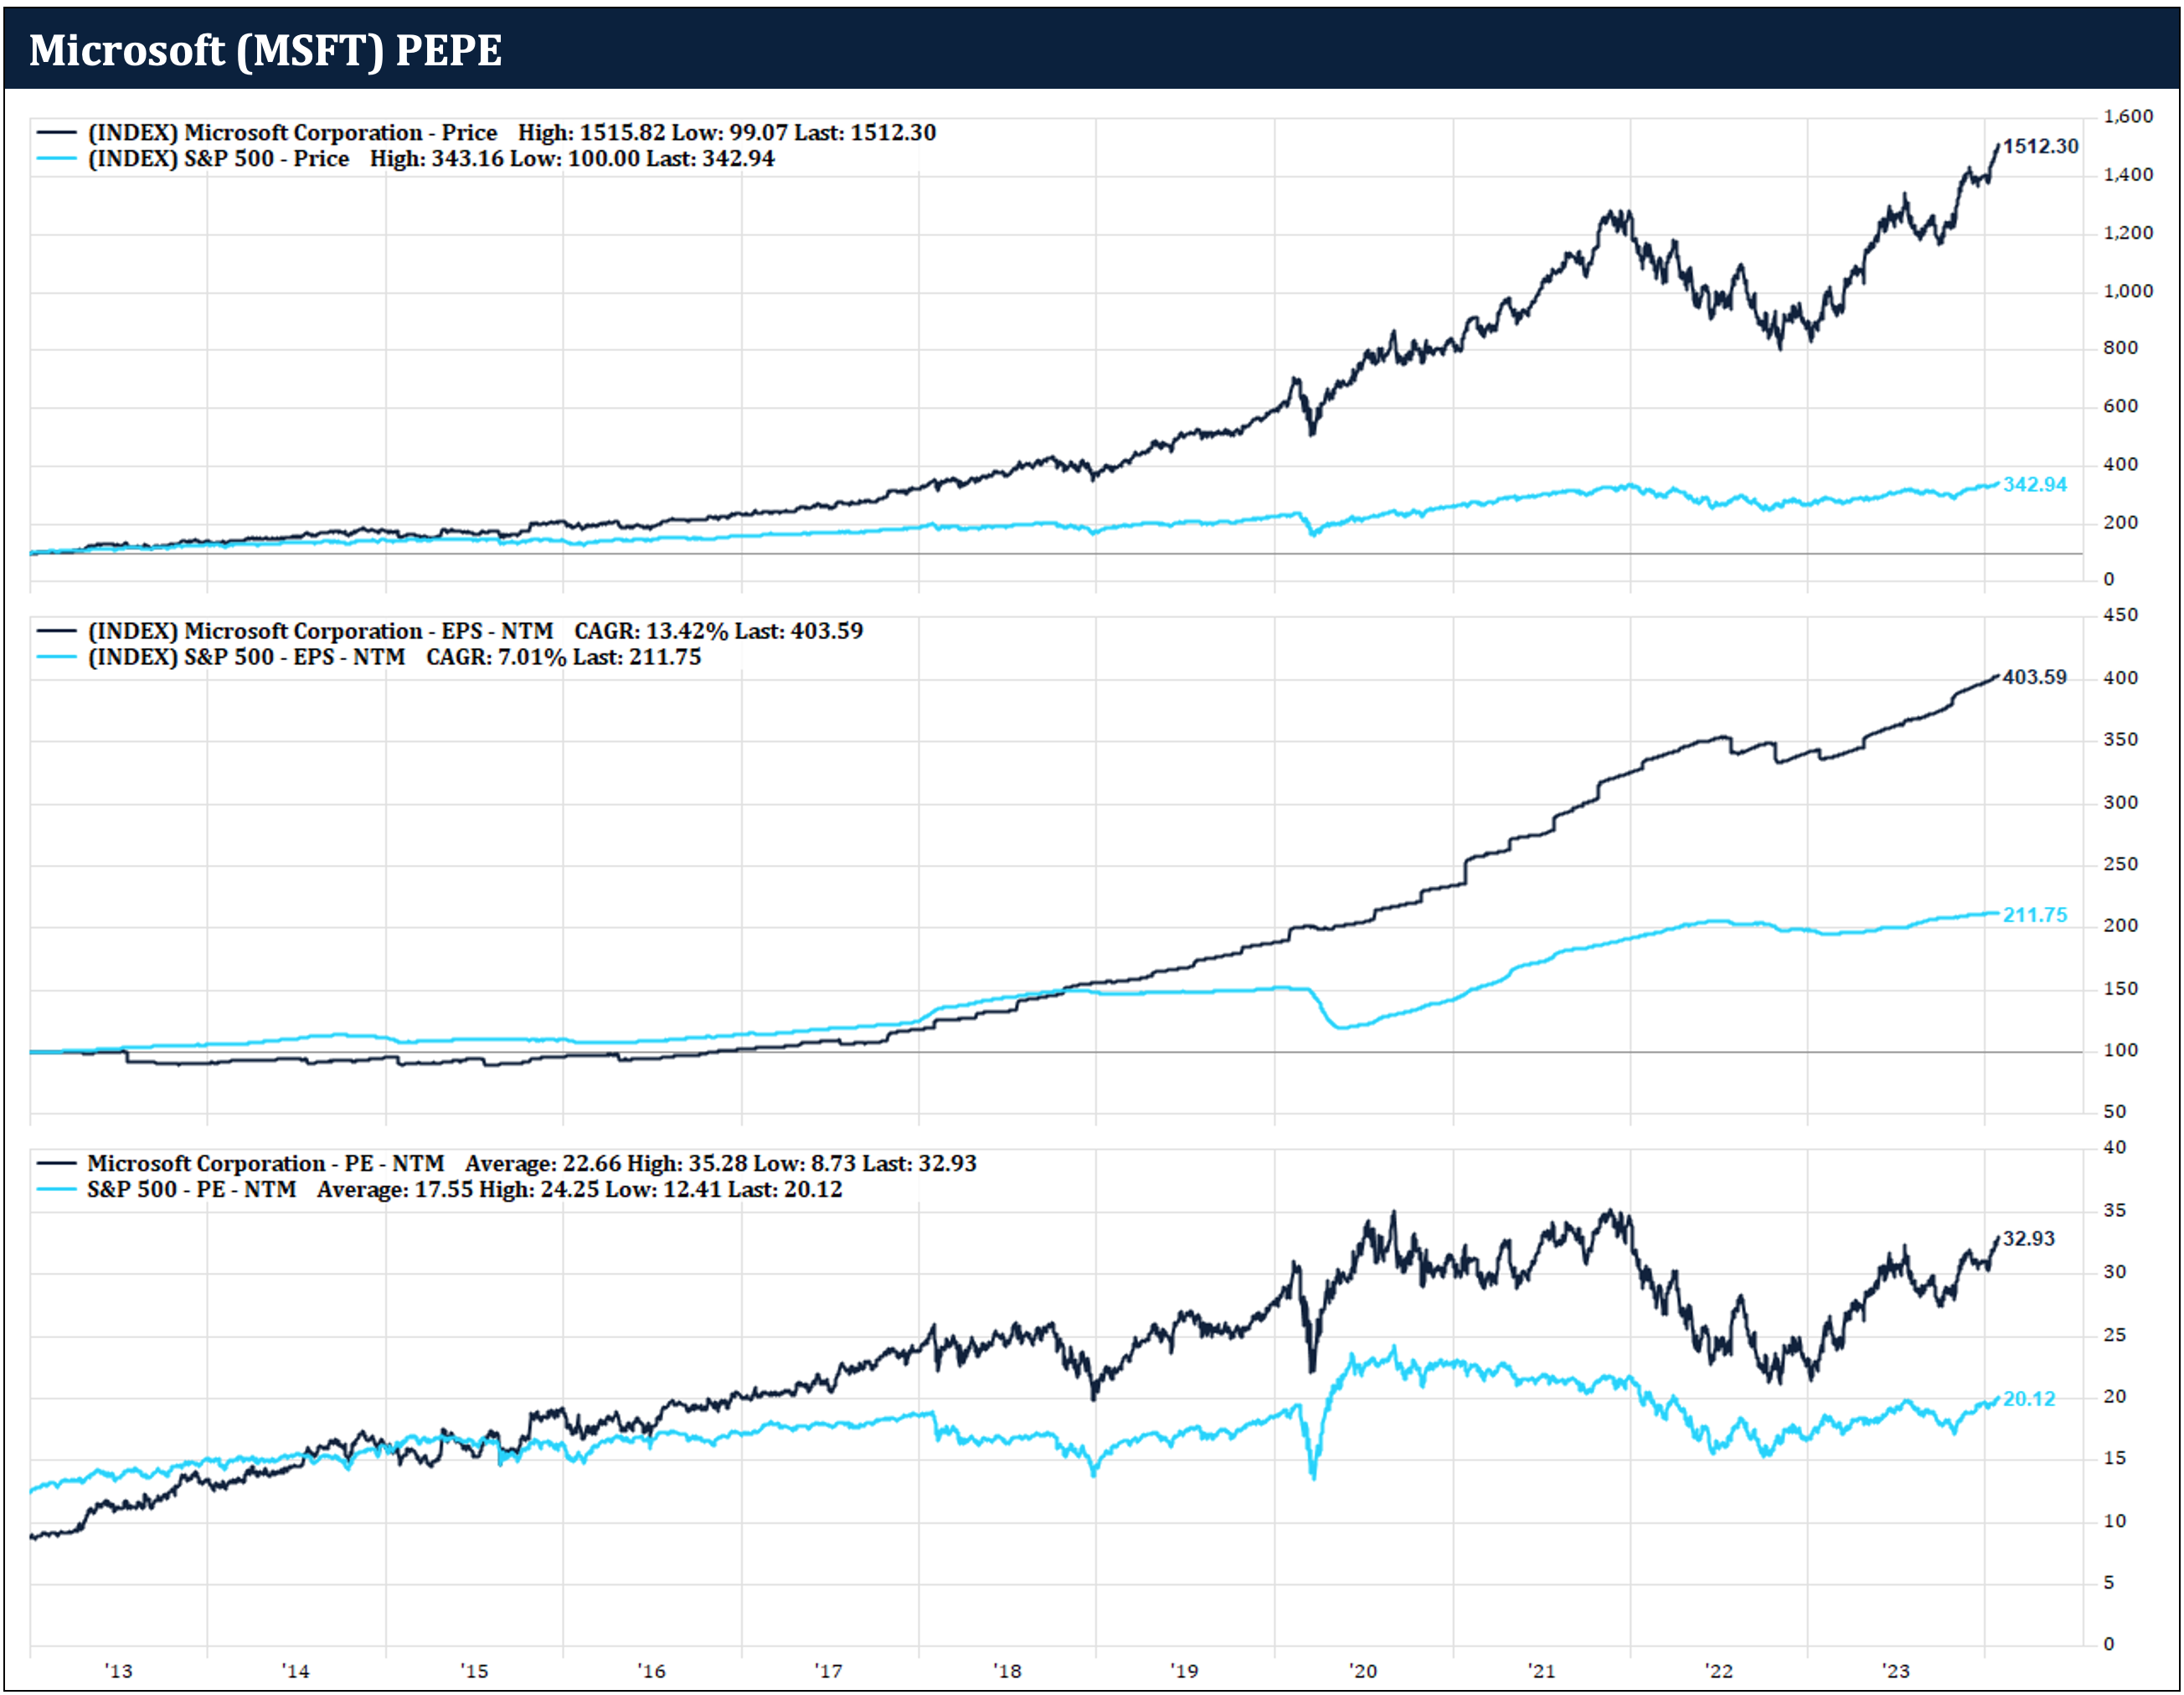
On January 27, 2024, the cover of Barron’s featured Microsoft as the world’s most valuable company. Microsoft certainly has an enviable record of earnings growth. We can see that below, where we have three graphs comparing Microsoft (dark blue) to the S&P 500 (bright blue) back to the start of 2013.
The top graph is the indexed price of Microsoft and the S&P 500. Over this period Microsoft’s price is up over 15x, compared to just 3.4x for the S&P 500.
The middle graph shows the indexed earnings of the two. We can see one reason why Microsoft has outperformed by so much is that its earnings have grown much more. Microsoft earnings are up over 4x compared to the S&P 500, up just over 2x.
THE CHALLENGER
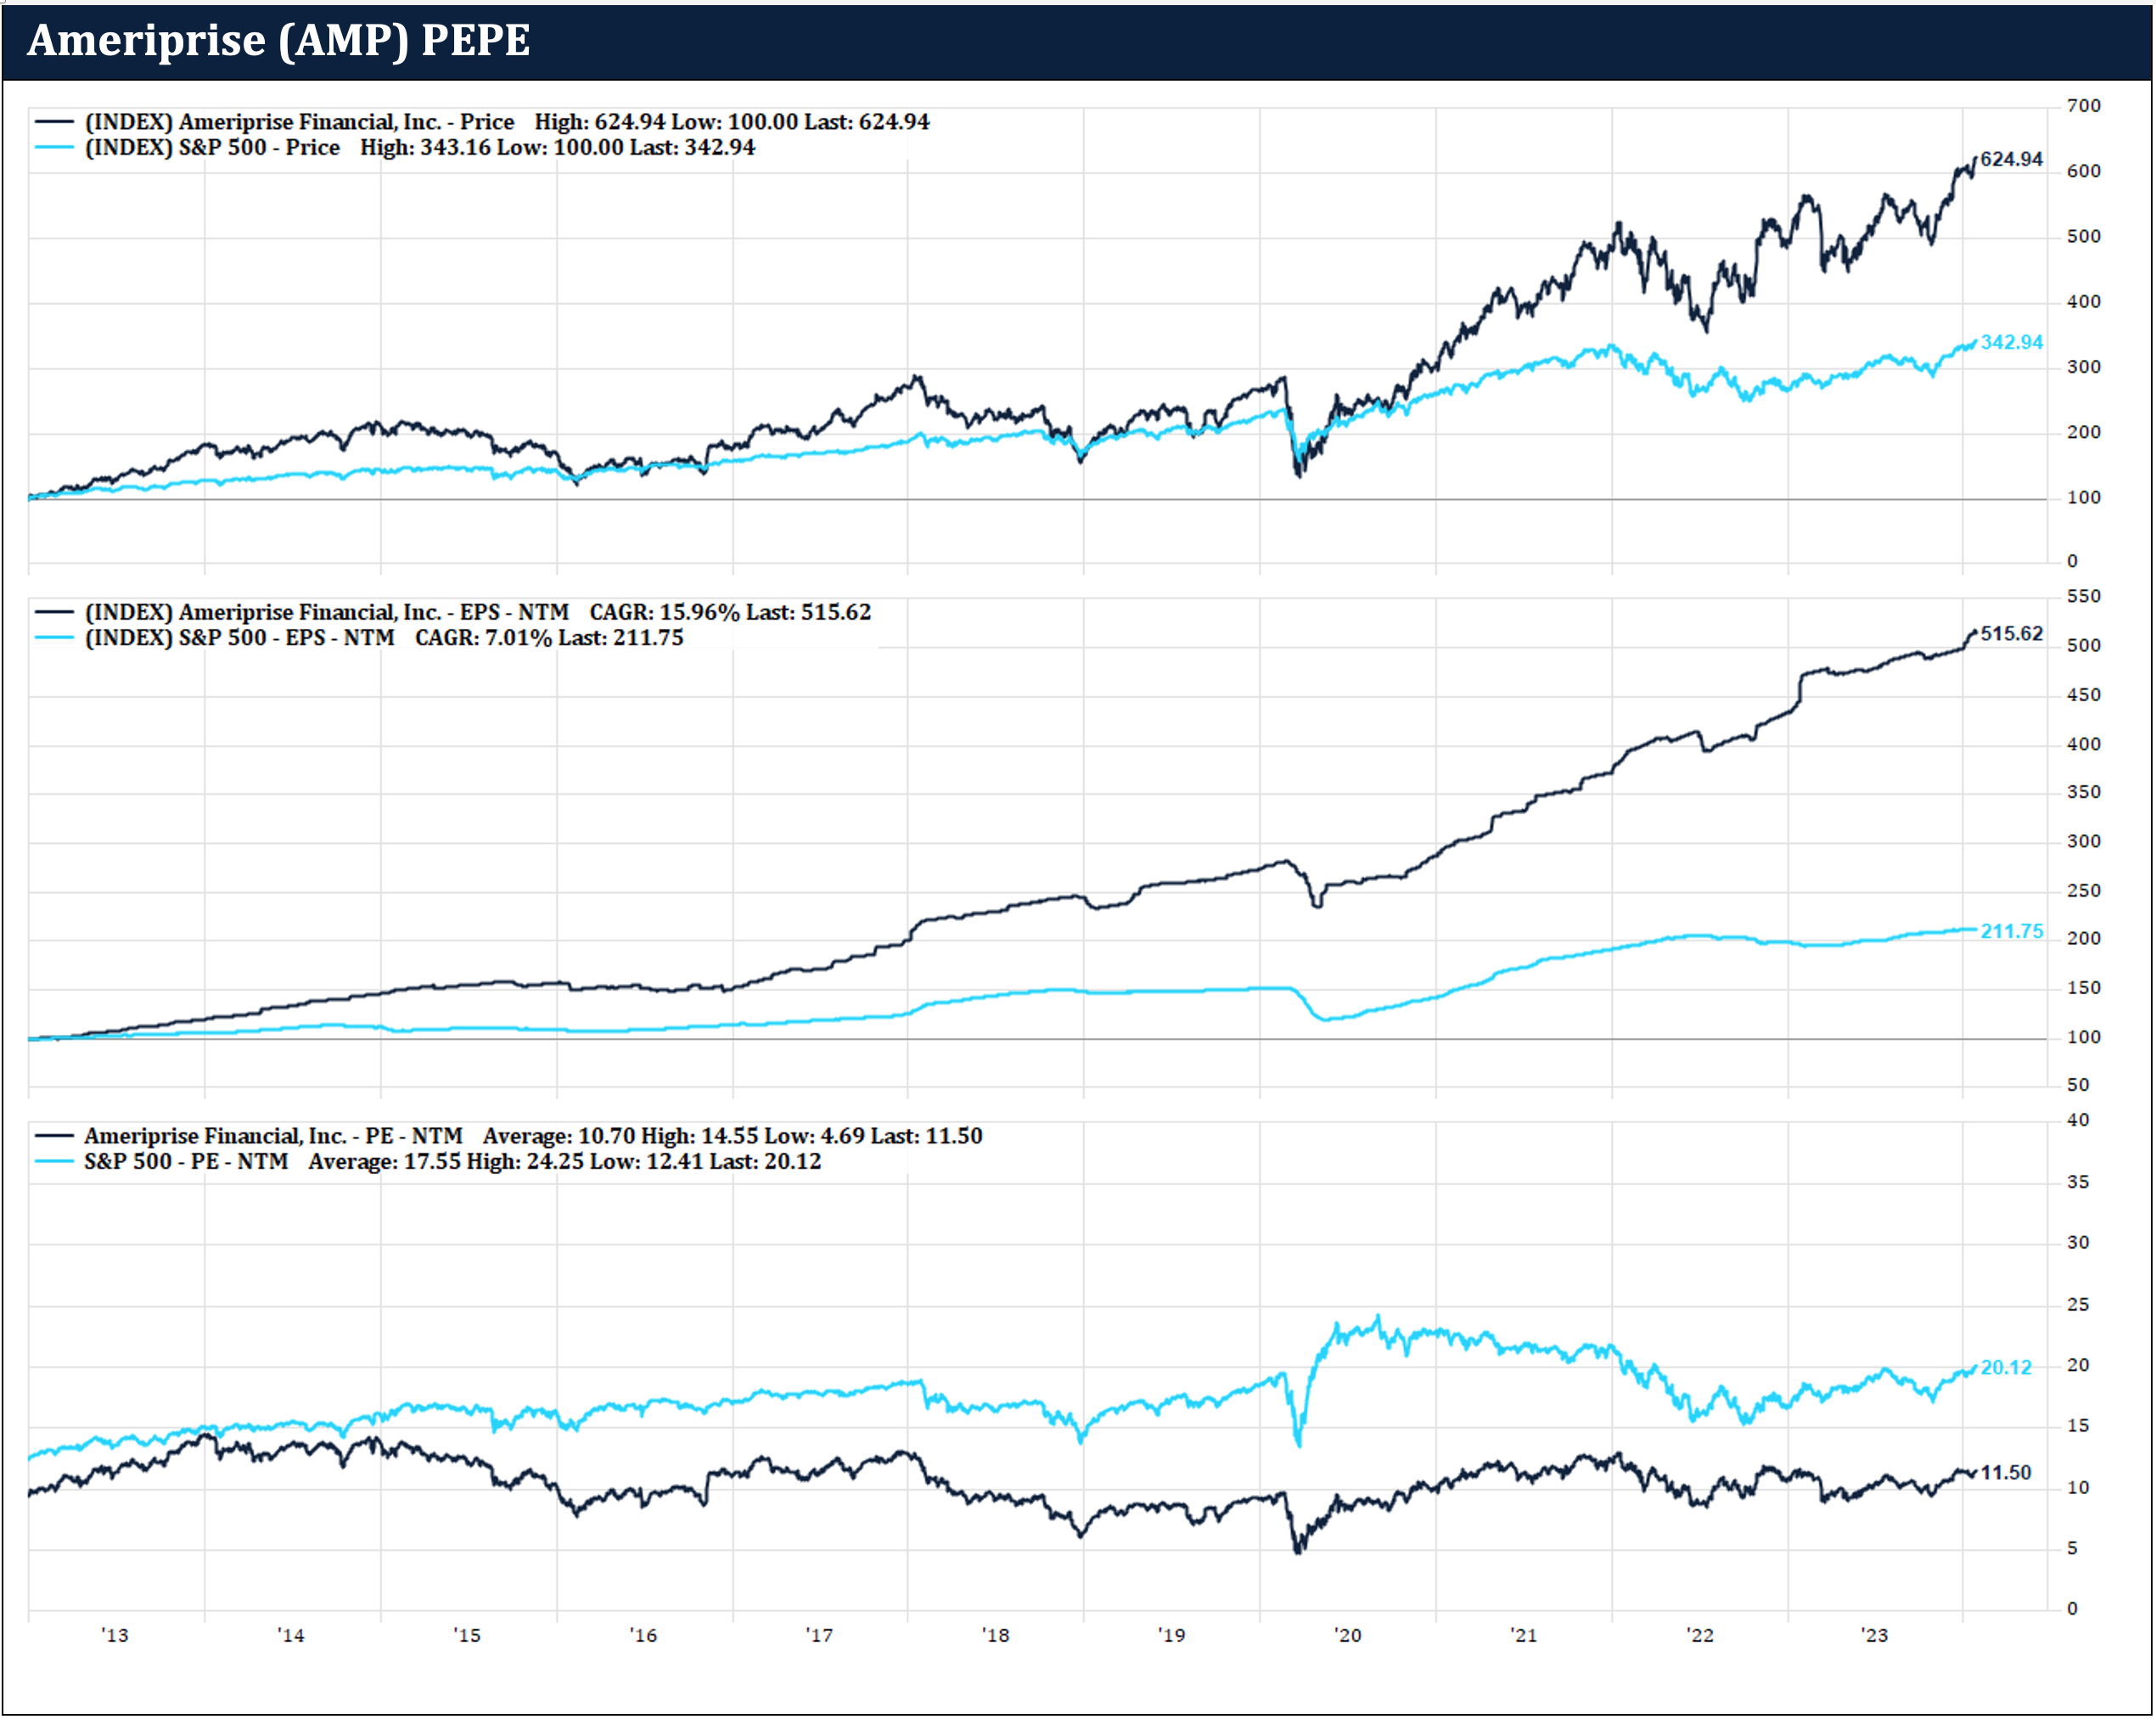
Lyrical does not own Microsoft (or the S&P 500 for that matter.) Instead, we own a concentrated portfolio of 33 stocks that we think of as Gems Amid the Junk™. These are quality companies that we have found in the junk heap of the cheapest quintile in our universe of the 1,000 largest U.S. stocks. The chart below shows the same three graphs of indexed price, indexed earnings, and P/E multiple for one of our gems: Ameriprise.
Using the same time period as we used for Microsoft above, we can see that since the start of 2013 Ameriprise’s stock (dark blue) has been an outperformer, but not to the same extent as Microsoft. As shown in the top graph below, Ameriprise’s price is up over 6x, which is impressive compared to just 3.4x for the S&P 500, but less impressive compared to Microsoft’s gain.
The middle graph shows the indexed earnings. We can see Ameriprise’s stock deserved to outperform the S&P 500 because its earnings grew over 5x, while the S&P 500 increased just over 2x.
 Source: FactSet.
Based on earnings growth alone, Ameriprise’s stock should have outperformed by more, but as the bottom graph shows, Ameriprise did not have the same multiple expansion as the S&P 500. The forward P/E of Ameriprise expanded 16%, from under 10x to about 11.5x. Meanwhile, the S&P 500 multiple expanded 50%, from less than 13x to over 20x. Put another way, over more than 10 years the S&P 500 P/E went from a 30% premium over Ameriprise to a 75% premium, even though Ameriprise’s earnings grew significantly faster.
THE BLIND TEST
Now let’s do a head-to-head comparison of Microsoft and Ameriprise. Until now, you might never have thought to compare these two unrelated companies. Furthermore, given Microsoft is the most valuable company in the world, it hardly seems like a fair fight. Well, prepare for an upset.
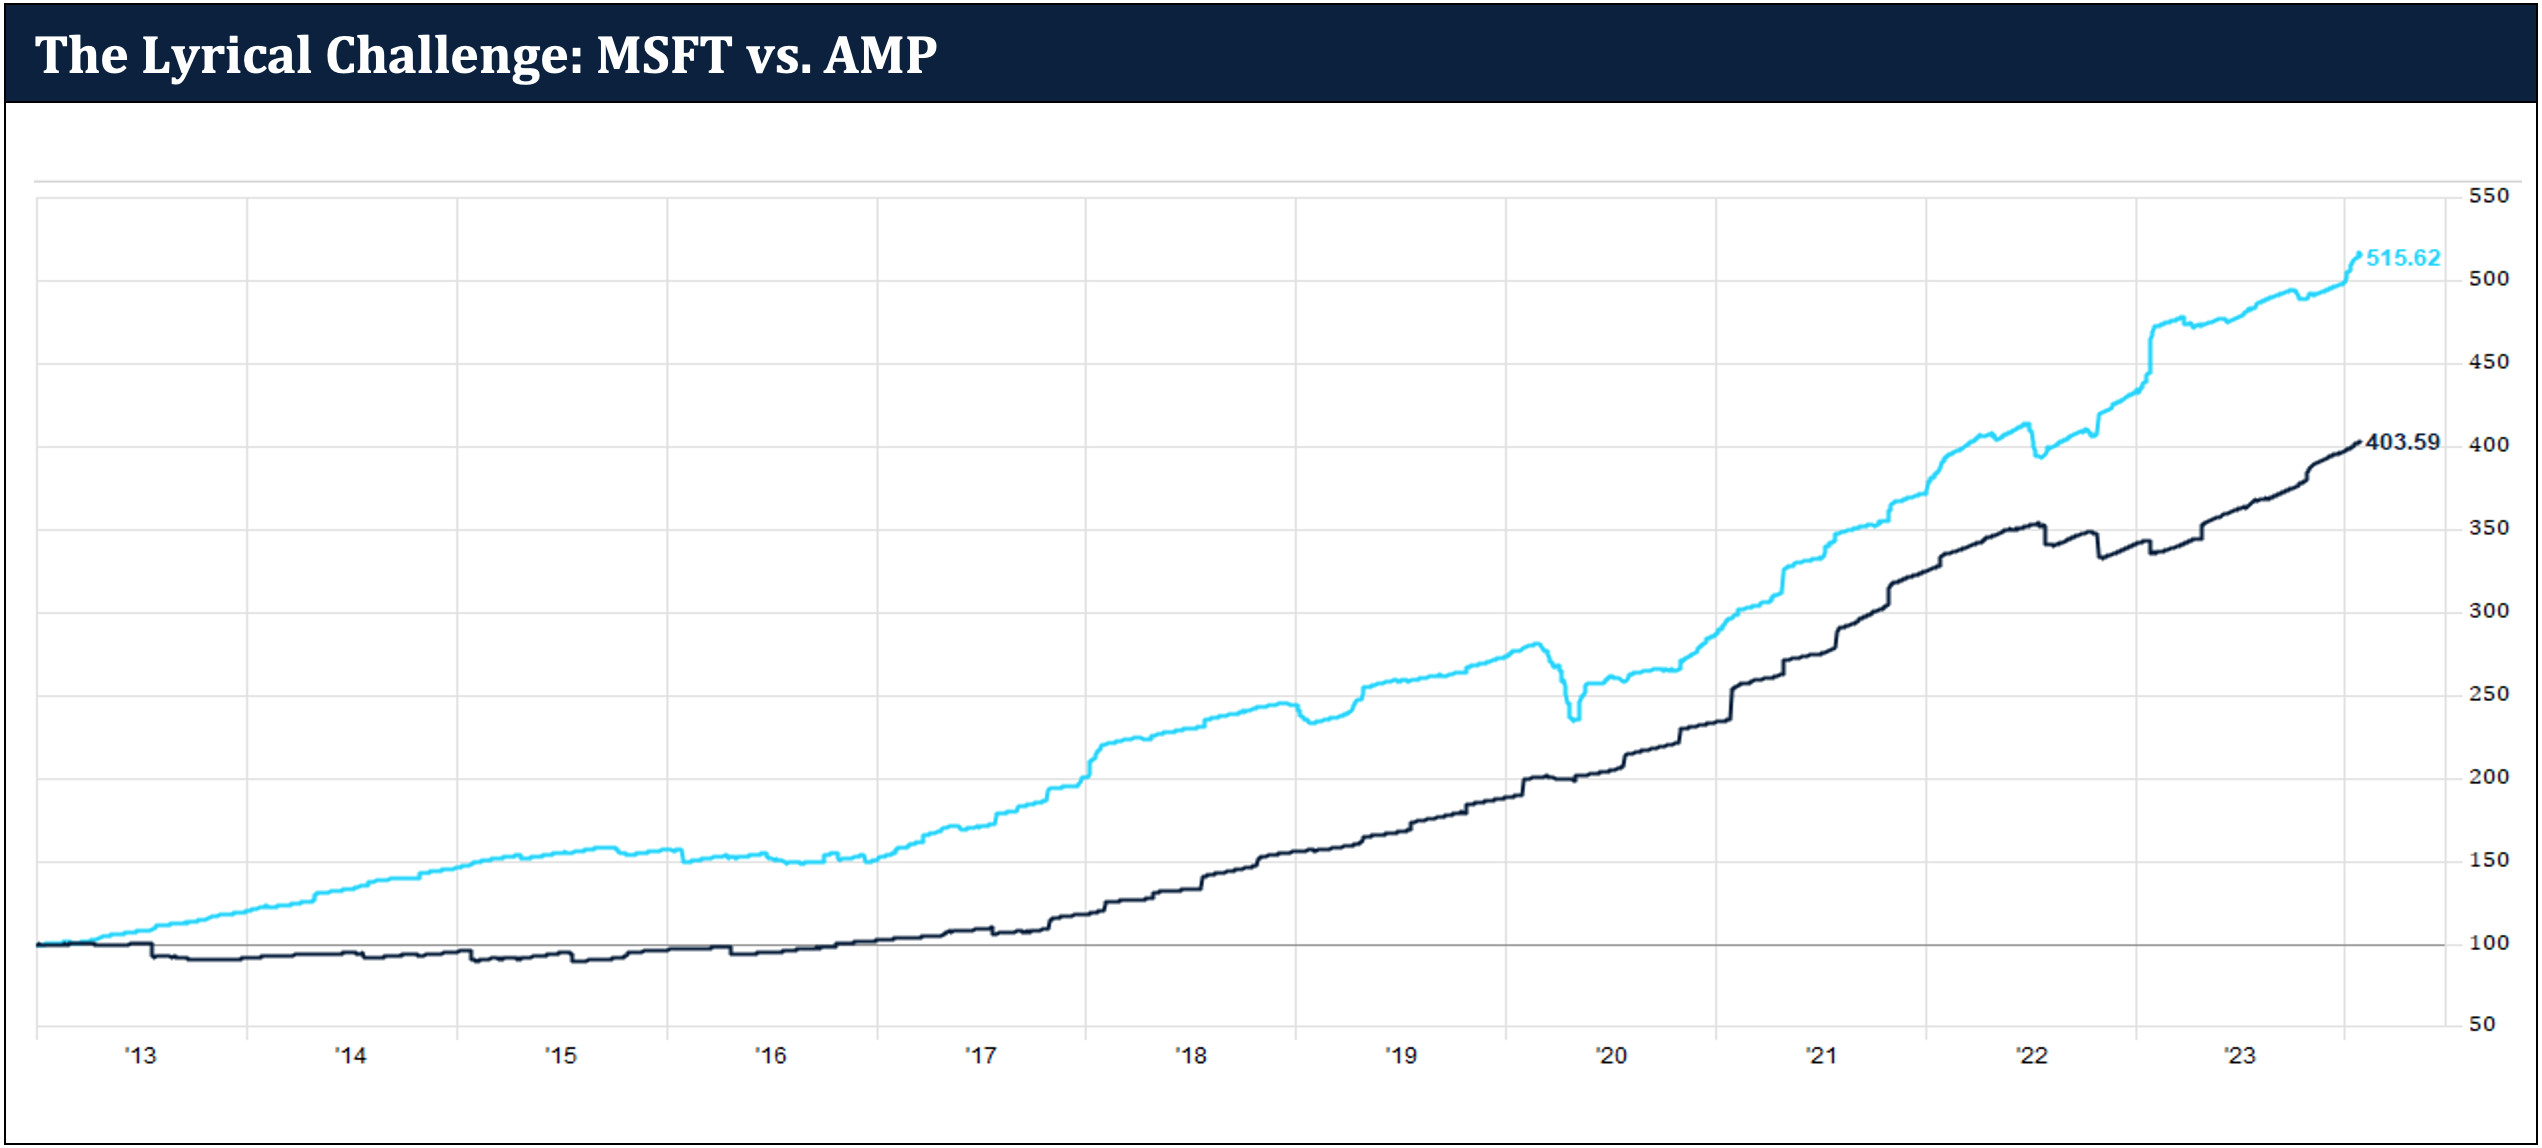
As the great NFL coach Bill Parcels said, “you are your record.” So, let’s look at the earnings records of these two companies over more than a decade. Forget the company names and all the preconceived notions that come along with them and focus on the earning growth of these two companies, shown in the graph below.
Which color line do you think has almost triple the multiple of the other? Which one belongs to the most valuable company in the world, and which one belongs to the company that is rarely discussed?
 Source: FactSet.
THE REVEAL
Of course, if Microsoft had the better earnings record, there would be no need to write this piece. As you have probably guessed, the faster earnings growth record belongs to Ameriprise.
This may seem like a crazy comparison. Microsoft is in the technology sector, providing software, cloud services and AI to the world. Ameriprise is in the financial sector, as one of the largest wealth and asset managers in the U.S.
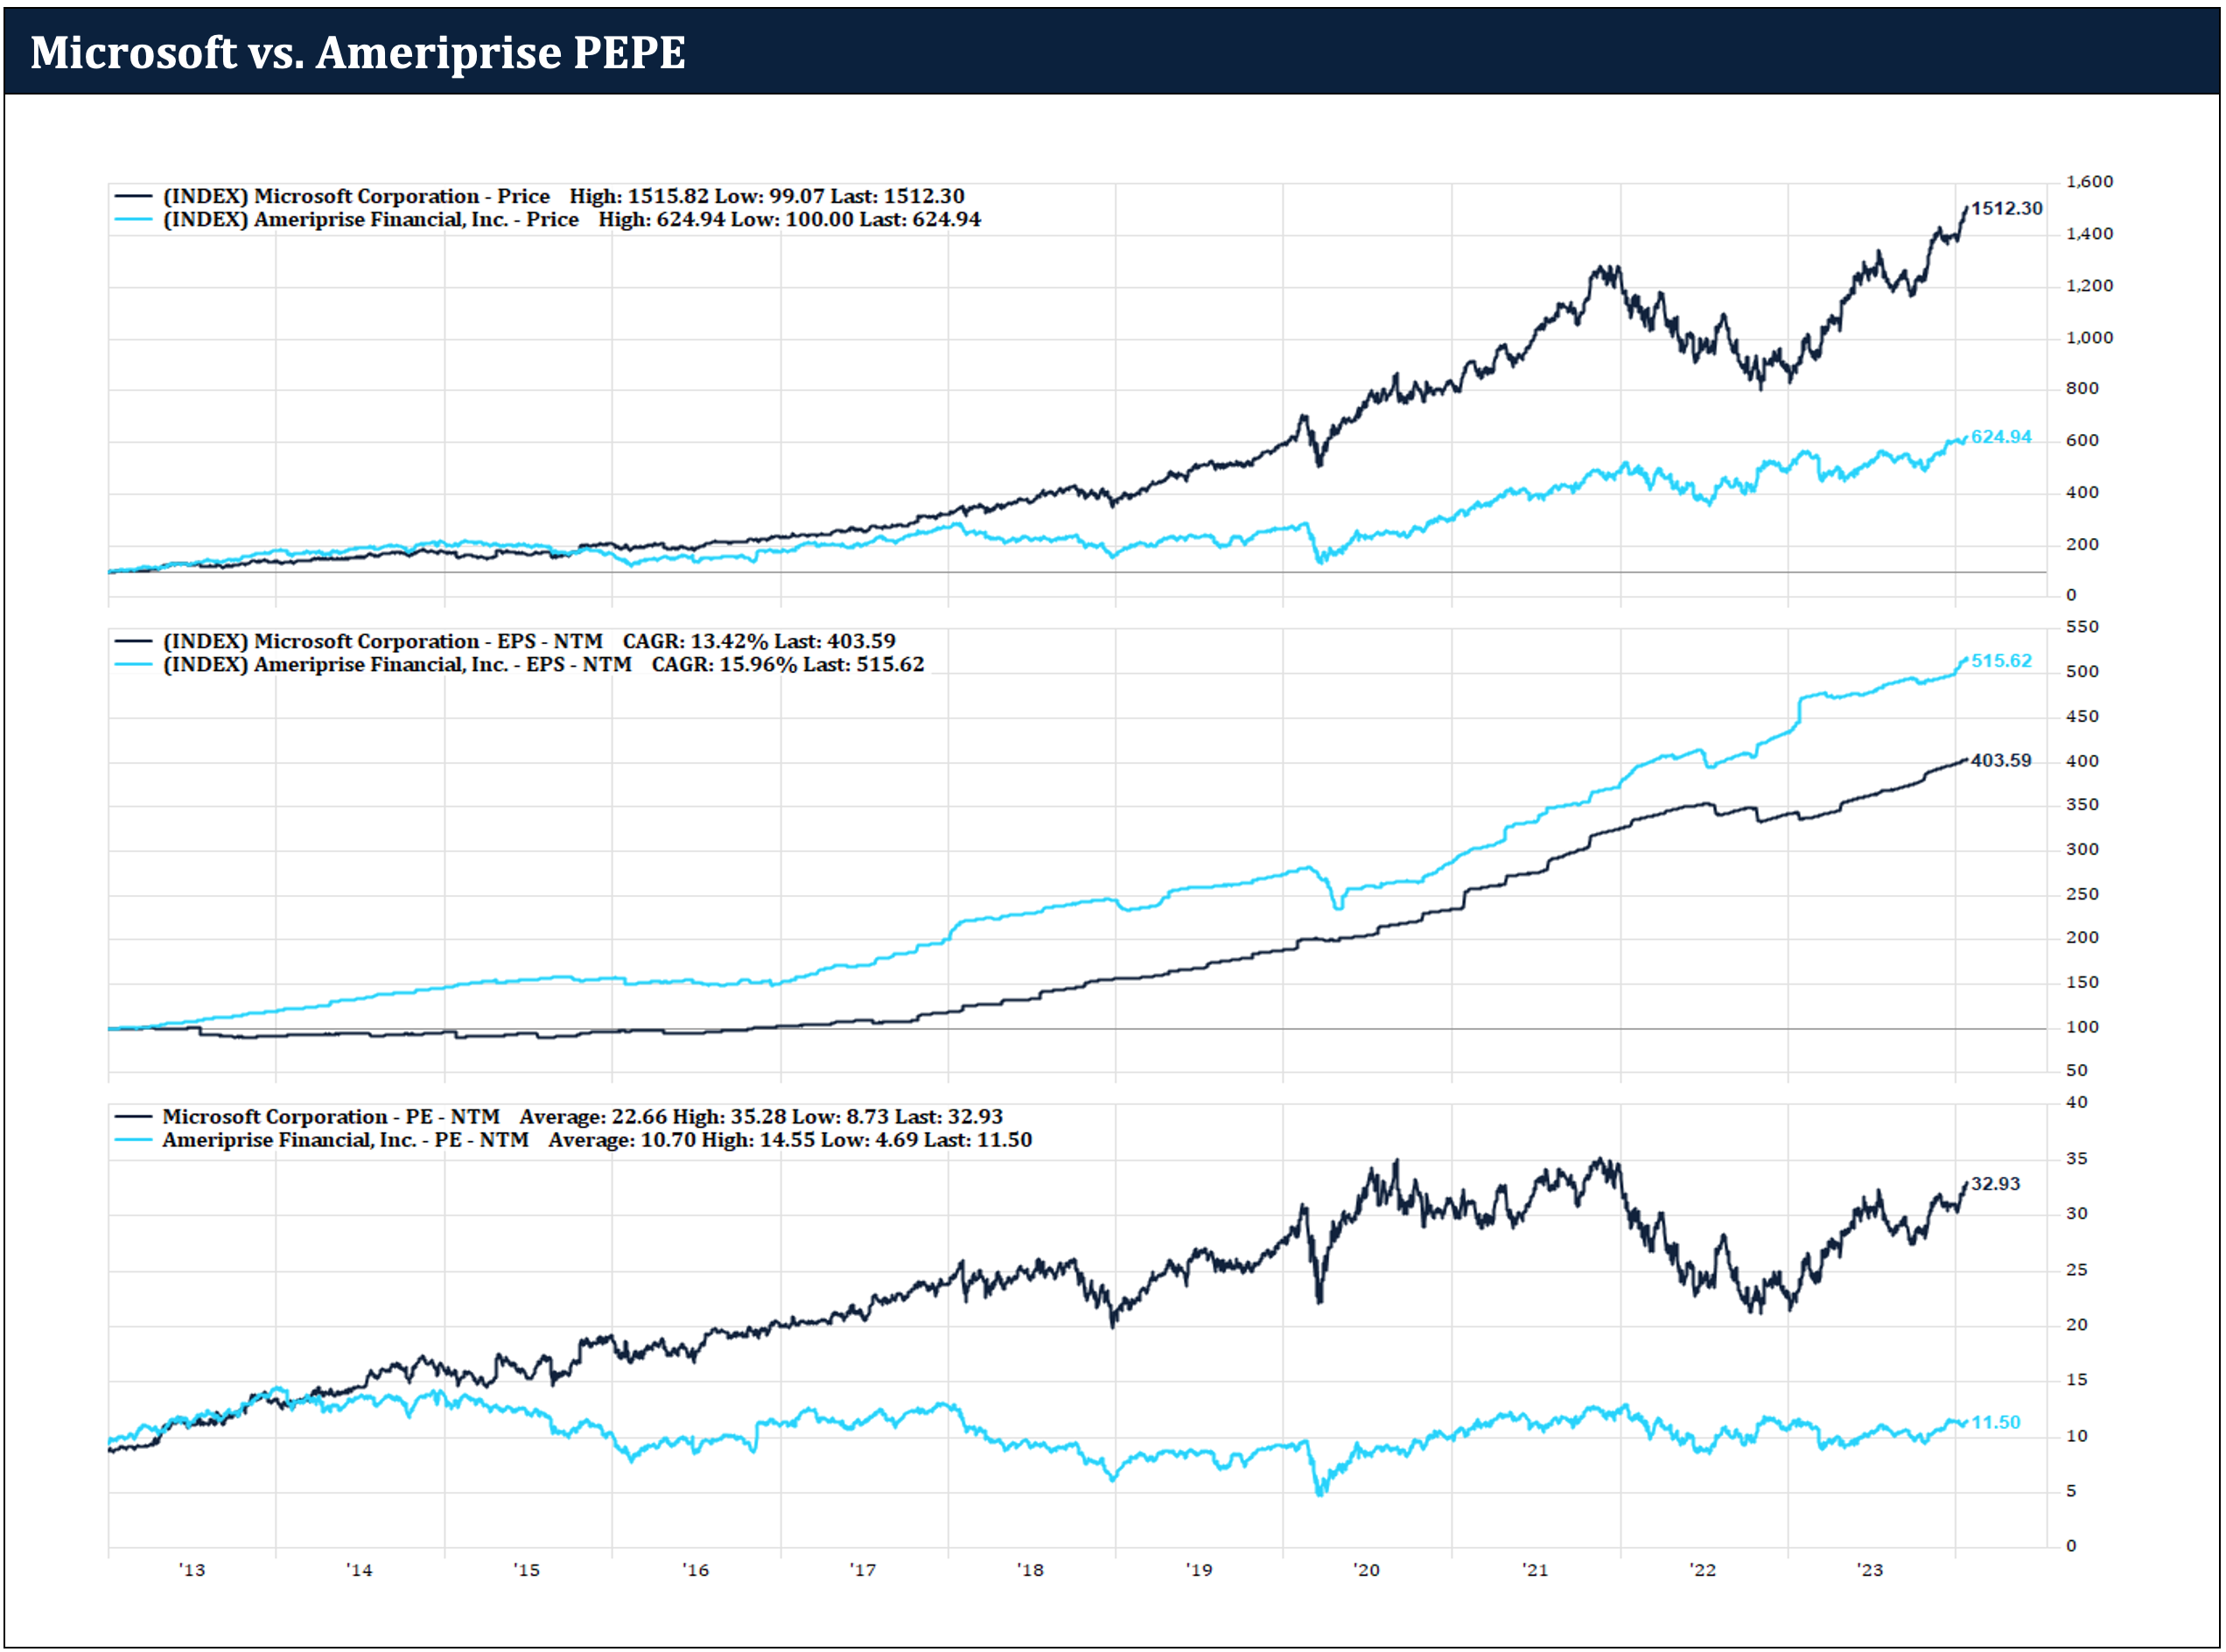
You may be surprised to learn that once upon a time these two companies traded for the same multiple. Below you will see the full three-panel comparison of Microsoft (dark blue) and Ameriprise (bright blue) back to 2013. We started this period in 2013, because the P/E multiples of the two companies tracked each other for more than a year. From the start of 2013 until early 2014, the P/E of both companies expanded from about 9x to about 15x. But from early 2014 until today, the P/Es have massively diverged. Microsoft’s P/E more than doubled to 33x, as Ameriprise’s P/E declined back to about 11.5x.
 Source: FactSet
Doesn’t Microsoft deserve a higher multiple because it is in technology? That is the conventional wisdom, but why would that be? You should have a higher multiple because your earnings grow faster (perhaps discounted for risk and uncertainty), not because of your sector label. Yes, Microsoft is in the technology sector, software is a great business, and the cloud and AI are fast growing areas. Yet, despite all that, since 2013 Microsoft has not been able to keep up with Ameriprise’s earnings growth.
VALUE GEMS HIDDEN IN PLAIN SIGHT
While we can get into a longer discussion about the merits of both these companies, that’s not the point of this piece. Rather, the point is to provide a glimpse into our uncommon investment perspective at Lyrical. We can find value gems hidden in plain sight by taking a Pepsi Challenge approach. We focus on the reality of the earnings record, and not on the perception of the company name or sector label.
One could look at Ameriprise and think it must be a bad business because it has a low P/E. We look at the earnings record over a long period of time and clearly see it has been a great business that has not only grown faster than the S&P 500 but has even outgrown Microsoft.
Of course, this blind test looks at the past, and what really matters for investing is the future. Great historical growth is no guarantee of future success, but it is often a sign of durable competitive advantages. Ultimately, we rely on our fundamental research process to determine the growth we assume for evaluating our investments.
At Lyrical, we find the comparison of Microsoft and Ameriprise fascinating. These two companies used to have the same multiple, and now one has almost triple the multiple of the other, despite a weaker record of earnings growth over an entire decade.
If you also find this example intriguing, we have 32 other great stock stories we can share.
In using Ameriprise as an example, please note we are selecting one of Lyrical’s successful holdings, just as we are comparing it to one of the S&P 500’s even more successful holdings, in Microsoft. All historical Lyrical recommendations and returns are available upon request.
Lyrical disclaims any duty to update historical information included herein, including whether we continue to hold the position that is mentioned. Specific investment examples are for illustrative purposes only and not necessarily representative of investments that will be made in the future.
Past performance is not necessarily indicative of future results.
The index shown is provided for illustrative purposes only, are unmanaged, reflects reinvestment of income and dividends and does not reflect the impact of advisory fees. Investors cannot invest directly in an index. Comparisons to indexes have limitations because indexes have volatility and other material characteristics that may differ from those of Lyrical’s strategies.
The S&P 500® is widely regarded as the best single gauge of large-cap U.S. equities. According to the Annual Survey of Assets by S&P Dow Jones Indices (“S&P”), an estimated USD 15.6 trillion is indexed or benchmarked to the index, with indexed assets comprising approximately USD 7.1 trillion of this total (as of Dec. 31, 2021). The index includes 500 leading companies and covers approximately 80% of available market capitalization.