In 2014, our U.S. Value Equity-EQ and U.S. Value Equity-CS composites returned +13.4% and +14.1%, respectively, compared to +13.7% for the S&P 500 Index and +13.5% for the Russell 1000 Value.
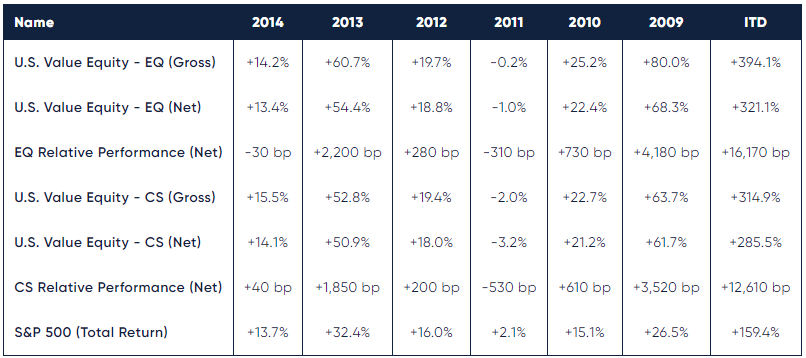
We had a solid year in 2014. On the one hand, our results were better than 80-90% of our peers based on the returns reported to the eVestment database (see below). On the other hand, we fell short of our long term goal of outperforming the U.S. equity markets by 500-1,000 bps per annum. To be clear, that goal is for a full market cycle, typically around ten years, but it still serves as a benchmark to assess shorter term performance.
In analyzing our portfolio’s performance attribution, we find it helpful to examine both the investment success rate and any skew in the distribution of returns. In 2014, 74% of our investments posted gains, and 50% outperformed the S&P 500. Since inception, 85% of our investments posted gains, and 65% outperformed the S&P 500.
Skew was a slightly negative factor in 2014, as our outperformers outperformed by 17% while our underperformers underperformed by 19%. Typically, our skew has been positive. Since inception, our outperformers outperformed by 30% annualized while our underperformers underperformed by 9% annualized.
Portfolio turnover in 2014 was 9.9%, and since inception it stands at 16.8% annualized. In total, we sold three stocks, as one approached fair value, and two were acquired. For two of the stocks sold, we added a compelling replacement from our inventory of researched investments. In the case of the third stock, we took the opportunity to reduce our total number of holdings to 33, which we had wanted to do for some time.
LOOKING FORWARD
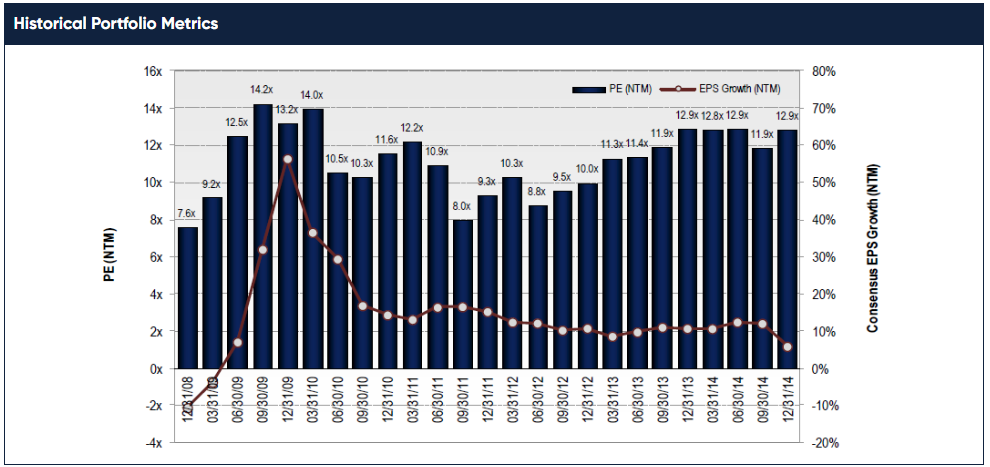
Even after another year of strong returns, our portfolio remains attractively valued, both in absolute terms and relative to the S&P 500. The P/E ratio for our portfolio on forward consensus earnings estimates was 12.9x at the end 2014. The S&P 500 has a valuation of 16.3x on this same basis, a premium of 26%.
The 2015 consensus growth estimate for our portfolio is 5.8%. However, two of our 33 stocks, both oil and gas producers with negative growth expected in 2015, mask an otherwise attractive growth rate within the portfolio. Excluding these two stocks increases the 2015 expected earnings growth of the portfolio by 2.5 points to 8.3%. This compares favorably to the 6.7% consensus growth expectation for the S&P 500.
Source: FactSet; Lyrical analytics
#1 IN EVESTMENT
We used eVestment’s database and examined the returns of all Large Cap, Mid Cap and All Cap Value products. While not all of these products are true peers of ours, we wanted to cast a wide net in capturing the performance data. In total, as of January 31, 2015 there are 578 products in those three categories that reported returns for all years since our 2009 inception. Lyrical Asset Management’s U.S. Value Equity – EQ ranks as the product with the highest return in that assembled, superset universe. The U.S. Value Equity – EQ product is also the top performer over the last three and five years. Additionally, our U.S. Value Equity – CS product ranks as the next highest returning product (second only to EQ) in the Large Cap universe, and in the top 1% (or 1.2%) of that superset universe over these same time periods.
For 2014, our U.S. Value Equity – EQ ranked in the top 20% of 646 products in the database. Our U.S. Value Equity – CS performed even better, ranking in the top 10%. (Note that eVestment uses gross performance for such rankings.)
HOW OFTEN DO WE OUTPERFORM?
It’s a simple question. How often do we outperform? We tell our investors and prospects that we are long term investors; we have low turnover and holding periods of five years or more. So does that mean one must wait five years to be rewarded? Fortunately, no.
We have analyzed the historical return for both our U.S. Value Equity-EQ and U.S. Value Equity-CS products. Our analysis tells us that the answer to that critical question of how often we outperform is 1) often, and 2) it depends.
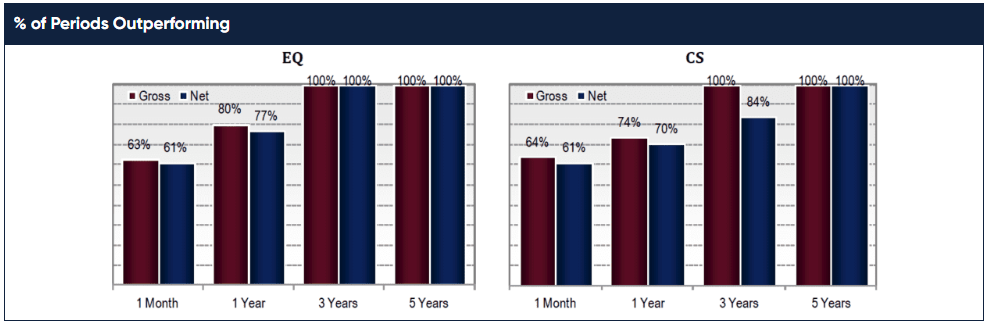
Our investment products do outperform the market most of the time, but the exact answer depends on the time horizon. If you look at our monthly returns, we find that over the last six years we have outperformed the S&P 500 more than 60% of the time.
If you can be a little more patient and look at our returns over a full year, our rate of outperformance rises considerably. The U.S. Value Equity-CS product has outperformed during 74% of twelve month periods on a gross basis, and 70% on a net basis. The U.S. Value Equity-EQ product has been even better, outperforming during 80% of twelve month periods on a gross basis, and 77% on a net basis.
One year is still a short time horizon for equity investing. If you take a three-year perspective, our rate of outperformance rises considerably again. In fact, on a gross basis both the U.S. Value Equity-EQ and U.S. Value Equity-CS products have outperformed in every rolling three-year period since our inception six years ago. The EQ product also outperformed in every three-year period net of fees, while the CS product net of fees outperformed in 84% of the periods.
Finally, for those who are willing to take a five year horizon, both the EQ and CS products have outperformed in every rolling period on a gross and net basis.
CONCLUSION
Six years ago, we launched Lyrical Asset Management on the foundation of a simple investment process we believed was engineered for success. We believed it to be sound and with great promise, but alas, we had little concrete data. Six years later, the foundation remains unchanged, but we now have a growing amount of concrete data to assess, in both absolute terms and relative to peers. From a pure performance perspective, our investment returns have outperformed virtually all of our peers throughout our entire history. This record has been generated through persistent performance across our positions, as 65% of our investments have outperformed the S&P 500 over their respective holding periods. This record has also been generated through persistent performance across time, as the vast majority of rolling periods have outperformed the S&P 500. With a dispassionate, repeatable approach grounded in the most fundamental principles of investing, we believe that the faithful execution of our process will continue to produce rewards for our investors over time.
THIS IS NOT AN OFFERING OR THE SOLICITATION OF AN OFFER TO INVEST IN THE STRATEGY PRESENTED. ANY SUCH OFFERING CAN ONLY BE MADE FOLLOWING A ONE-ON-ONE PRESENTATION, AND ONLY TO QUALIFIED INVESTORS IN THOSE JURISDICTIONS WHERE PERMITTED BY LAW.
THERE IS NO GUARANTEE THAT THE INVESTMENT OBJECTIVE OF THE STRATEGY WILL BE ACHIEVED. RISKS OF AN INVESTMENT IN THIS STRATEGY INCLUDE, BUT ARE NOT LIMITED TO, THE RISKS OF INVESTING IN EQUITY SECURITIES GENERALLY, AND IN A VALUE INVESTING APPROACH, MORE SPECIFICALLY. MOREOVER, PAST PERFORMANCE SHOULD NOT BE CONSTRUED AS AN INDICATOR OF FUTURE PERFORMANCE.
THE S&P 500 INDEX IS A MARKET CAPITALIZATION WEIGHTED INDEX COMPRISED OF 500 WIDELY-HELD COMMON STOCKS.
THE RUSSELL 1000 VALUE INDEX MEASURES THE PERFORMANCE OF THE LARGE-CAP VALUE SEGMENT OF THE U.S. EQUITY UNIVERSE. IT INCLUDES THOSE RUSSELL 1000 COMPANIES WITH LOWER PRICE-TO-BOOK RATIOS AND LOWER EXPECTED GROWTH VALUES. THE RUSSELL 1000 VALUE INDEX IS CONSTRUCTED TO PROVIDE A COMPREHENSIVE AND UNBIASED BAROMETER FOR THE LARGE-CAP VALUE SEGMENT. THE INDEX IS COMPLETELY RECONSTITUTED ANNUALLY TO ENSURE NEW AND GROWING EQUITIES ARE INCLUDED AND THAT THE REPRESENTED COMPANIES CONTINUE TO REFLECT VALUE CHARACTERISTICS.
ADDITIONAL INFORMATION REGARDING LAM –U.S. VALUE EQUITY-CS:
PERFORMANCE FIGURES PRIOR TO AUGUST 2013 REFLECT THE MODEL, HYPOTHETICAL RESULTS FOR A HYPOTHETICAL PORTFOLIO PURSUING THE MARKET CAPITALIZATION WEIGHTED INVESTMENT GUIDELINES (THE “GUIDELINES”) DESCRIBED BELOW, AND DO NOT REPRESENT RETURNS OF ACTUAL INVESTMENTS MADE. THERE ARE A VARIETY OF LIMITATIONS INHERENT IN MODEL RESULTS. TRANSACTION EXPENSES HAVE BEEN INCLUDED AT FIVE CENTS PER SHARE, TO REFLECT COMMISSIONS AND EXPECTED MARKET IMPACT. DIVIDENDS HAVE BEEN INCLUDED IN THE RETURNS. LAM’S CLIENTS HAD RESULTS THAT WERE MATERIALLY DIFFERENT FROM THOSE PORTRAYED IN THE MODEL.
MARKET CAPITALIZATION WEIGHTED INVESTMENT GUIDELINES
LAM’S ORIGINAL, U.S. VALUE EQUITY – EQ IS AN APPROXIMATELY 34 STOCK PORTFOLIO THAT IS EQUAL WEIGHTED AT COST TO TARGET 99% INVESTED WITH 1% CASH, HENCE APPROXIMATELY 3% PER POSITION. WE HAVE PICKED A BENCHMARK CAPITALIZATION LEVEL (THE “CAPITALIZATION BENCHMARK”) EQUAL TO $11.2BN AS OF DECEMBER 31, 2013 AND EQUAL TO $11.2BN MULTIPLIED BY THE QUOTIENT DERIVED BY DIVIDING THE LEVEL OF THE S&P 500 INDEX® AT ALL OTHER TIMES BY 1,848.36 (THE CLOSING PRICE OF THAT INDEX ON DECEMBER 31, 2013).
TO REFLECT A PORTFOLIO THAT HAS GREATER LIQUIDITY, WE CREATED A MODEL PORTFOLIO WITH MODIFIED PORTFOLIO POSITION WEIGHTS.
- STOCKS WITH A MARKET CAPITALIZATION GREATER THAN THE CAPITALIZATION BENCHMARK HAVE BEEN MADE EQUAL WEIGHTED FULL POSITIONS.
- STOCKS WITH A MARKET CAPITALIZATION LESS THAN THE CAPITALIZATION BENCHMARK HAVE HAD THEIR POSITION WEIGHTS SCALED IN PROPORTION TO THEIR MARKET CAP.
FOR EXAMPLE, A STOCK WITH A $5.6BN MARKET CAPITALIZATION AS OF DECEMBER 31, 2013 WOULD HAVE BEEN GIVEN AN INITIAL PORTFOLIO WEIGHT OF 0.5X A FULL POSITION. A STOCK WITH A $3.4BN MARKET CAPITALIZATION AS OF DECEMBER 31, 2013 WOULD HAVE BEEN GIVEN AN INITIAL PORTFOLIO WEIGHT OF 0.3X A FULL POSITION.
WITH LESS CAPITAL ALLOCATED TO THE LESS LIQUID STOCKS, WE HAVE GROSSED UP THE SIZE OF A FULL POSITION FROM THE CURRENT 2.9% IN THE EQUAL WEIGHTED ORIGINAL PORTFOLIO TO APPROXIMATELY 3.8% IN THE HYPOTHETICAL MARKET CAPITALIZATION WEIGHTED PORTFOLIO, TO ACHIEVE A MODEL PORTFOLIO WITH 99% INVESTED IN STOCKS AND 1% CASH.
PERFORMANCE ESTIMATION METHODOLOGY
TO ESTIMATE THE HISTORICAL PERFORMANCE OF THE U.S. VALUE EQUITY–CS, MARKET CAPITALIZATION WEIGHTED PORTFOLIO, WE APPLIED THE METHODOLOGY DESCRIBED ABOVE TO THE STOCKS IN OUR ORIGINAL U.S. VALUE EQUITY-EQ PORTFOLIO OF DECEMBER 31, 2008.
WE MODELED THAT ALL PURCHASES OF NEW HOLDINGS AND EXITS FROM EXISTING HOLDINGS THAT TOOK PLACE DURING A MONTH IN OUR ACTUAL PORTFOLIOS TOOK PLACE AS OF THE END OF THAT MONTH IN THE BACKTEST MODEL.
IN MONTHS WHERE CASH WAS NEEDED BECAUSE THE SIZE OF THE PURCHASED STOCK EXCEEDED THE PROCEEDS FROM THE STOCK SOLD, WE MODELED THAT WE TRIMMED THE LARGEST POSITION (AT MARKET) IN THE PORTFOLIO TO GENERATE ENOUGH CASH TO COVER THE DIFFERENCE.
IN MONTHS WHERE THE CASH POSITION ROSE TO LEVELS ABOVE 1% WE DID NOT REINVEST THE EXTRA CASH.
THESE MODEL RESULTS ARE UNAUDITED AND SUBJECT TO REVISION AND SHOW ALL PERIODS BEGINNING WITH THE FIRST FULL MONTH IN WHICH THE ADVISOR MANAGED ITS FIRST FEE-PAYING ACCOUNT. HYPOTHETICAL NET RETURNS INCLUDE A 1.25% BASE FEE.