In 2015, the U.S. Value Equity-EQ and U.S. Value Equity-CS composites produced gross returns of -5.0% (-5.7% net) and -5.1% (-6.3% net), respectively. Comparatively, the S&P 500 and Russell 1000 Value produced total returns of +1.4% and -3.8%, respectively.
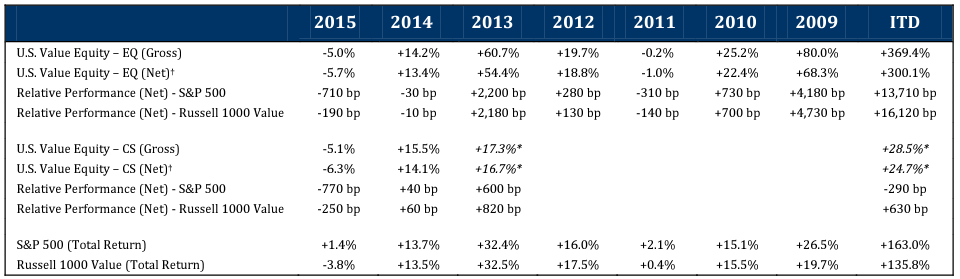
For only the second time in our seven year history, we did not outperform our benchmarks for the year. It was a difficult year to outperform given the narrowness of the market. The 50 largest stocks in the S&P 500 outperformed the index by the widest margin since 2008. Furthermore, the S&P 500 would have finished the year down 1%, instead of up 1.4%, if just four stocks were excluded (AMZN, GOOG, MSFT, FB). When so much return comes from so few stocks, it is particularly difficult for active managers to outperform. It is possible to outperform in these markets, but in 2015 we did not succeed. Our performance was more in line with the Russell 1000 Value, and was within the general range of expected outcomes for any given year. We do not know when the value we see in our portfolio will be recognized by the market, but we do expect that when this happens, as we have seen in our past, the returns will be exceptionally attractive.
In analyzing our portfolio’s performance attribution, we find it helpful to examine both the investment success rate and the skew in the distribution of returns. In 2015, 46% of our investments posted gains, and 43% outperformed the S&P 500. This is the first year that either the absolute or relative success rate was below 50%. We attribute the low success rate to the narrowness of the S&P 500. Since inception, 79% of our investments posted gains, and 62% outperformed the S&P 500.
Skew was also a negative factor in 2015. Typically, our skew is positive by over a two-to-one ratio. Since inception, our outperformers outperformed by 39% annualized while our underperformers underperformed by 18% annualized. However, in 2015 our outperformers outperformed by 13% while our underperformers underperformed by 22%. This negative skew is exemplified by the fact that we had one stock up over 40%, but had four stocks down more than 40%. While there were several big decliners in the portfolio, many of those stocks actually had solid fundamental results in 2015, leading us to believe the losses will be temporary, and to expect these stocks to recover and advance.
Portfolio turnover in 2015 was 7.4%, and stands at 15.5% annualized since inception. During the year, we sold two stocks which approached fair value. For both stocks sold, we added a compelling replacement from our inventory of researched investments. Most of our turnover is driven by stocks approaching fair value. Thus, in a flat or down year like 2015, we expect to have less than normal turnover.
LOOKING FORWARD
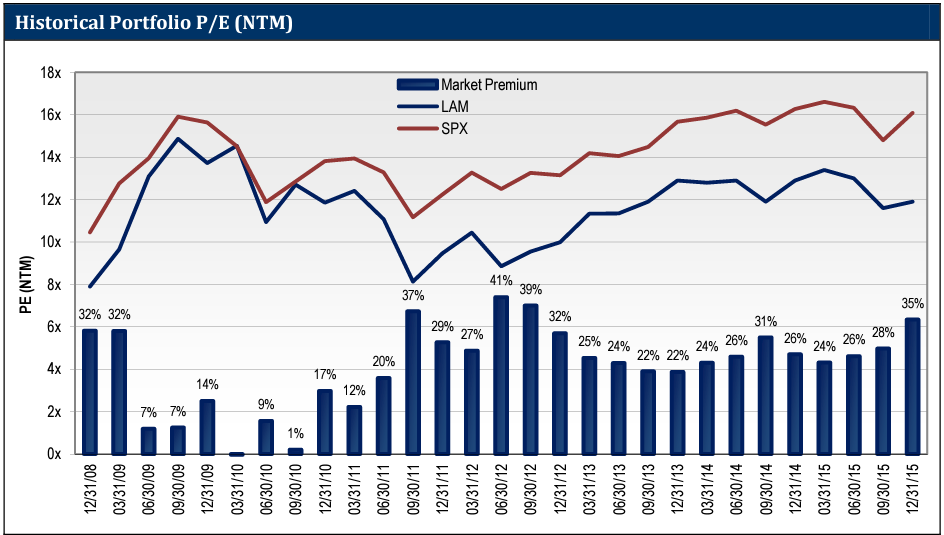
With solid fundamental results and a decline in stock prices, the portfolio valuation became even more compelling. The P/E ratio for our portfolio on forward consensus earnings estimates was 11.9x at the end of 2015. The S&P 500 had a valuation of 16.1x on this same basis, a premium of 35%. Historically, the average premium of the S&P 500 to our portfolio is ~25%. The current premium of 35% is near a historical high. The only time the premium has been greater was at the end of 3Q11, 2Q12, and 3Q12. After each of those periods, over the following twelve months, the LAM-EQ net returns outperformed the S&P 500 by 582 bp, 2,045 bp, and 2,130 bp, respectively.
Source: FactSet; Lyrical analytics
eVESTMENT PEER COMPARISON
We used eVestment’s database and examined the returns of all Large Cap, Mid Cap and All Cap Value products. While not all of these products are our true peers, we wanted to cast a wide net in capturing the performance data. In total, as of January 25, 2016 there are 555 products in those three categories that reported returns for all years since our 2009 inception. Lyrical Asset Management’s U.S. Value Equity-EQ ranks as the product with the highest return for that period in that assembled, superset universe. Additionally, our U.S. Value Equity–CS product ranks as the next highest returning product (second only to EQ) in the Large Cap universe, and in the top 1% of that superset universe over the same time period.
For 2015, the U.S. Value Equity-EQ and U.S. Value Equity-CS composites ranked in the 70th and 71st percentiles of 507 products in the database, respectively. (Note that eVestment uses gross performance for such rankings.)
VALUE INDEX LOSES AGAIN TO GROWTH INDEX
In 2015, the Russell 1000 Growth index outperformed the Russell 1000 Value index by 9.5%, the widest spread since 2008. Since 2009, the Russell 1000 Value index has underperformed the S&P 500 by 27.2% (163.0% vs. 135.8%), or 180 bp per annum (14.8% vs. 13.0%).
"REAL" VALUE HAS DONE MUCH BETTER THAN THE VALUE INDEX
At Lyrical, we do not regard the Russell 1000 Value index as a real value index. Russell forces every stock of the base index into either the Growth or Value index, thus diluting the impact of the “real” value stocks in the Value index with many more that are at or near market multiples. For us, a better benchmark for tracking the performance of a “real” value approach is an equal weighted index of the lowest price‐to‐book (P/B) companies. While the Russell 1000 Value index has 35 years of history, we have been able to get our hands on a 55 year history of a Low P/B series. Looking at the returns of this Low P/B series helps put “real” value investing results in a better historical context.
Since 2009, the Low P/B index has actually outperformed both the Russell 1000 Value and the S&P 500. Low P/B has returned 186.9%, 23.9% more than the S&P 500 and 51.1% more than the Russell 1000 Value. On an annualized basis, Low P/B has returned 16.2%, 140 bp more than the S&P 500 and 320 bp more than the Russell 1000 Value.
While this outperformance is good, it is still well below the 55 year history of the data series. Since 1960, Low P/B has returned 17.0% per annum, 520 bp better than the 11.8% annualized total return of the S&P 500. Even after recent woes, “real” value investing has clearly been a superior long term proposition.
THE LONG TERM AND RECENT HISTORY OF "REAL" VALUE
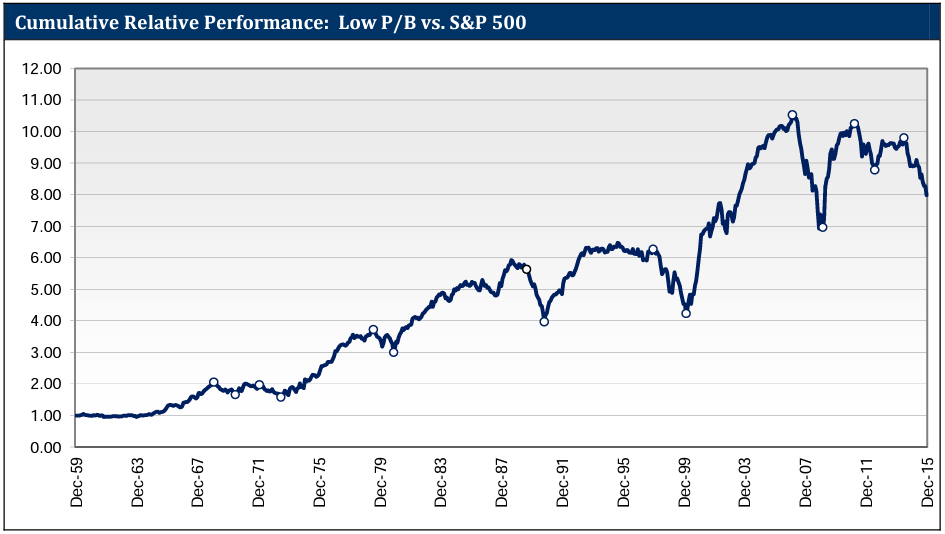
Low P/B has significantly outperformed over the long term, but there have been several periods where it has temporarily underperformed. The chart below plots the relative performance of Low P/B versus the S&P 500. The long term trend of the chart is undeniable. Low P/B outperformance is persistent over the decades.
Source: Sanford Bernstein; Lyrical analytics
The short term trend of the chart is also undeniable. The performance of “real” value investing has been in a slump. The Low P/B series returned -9.1% in 2015, 530 bp worse than the Russell 1000 Value, and 1,050 bp behind the S&P 500. This past year was a continuation of a trend that started in July 2014, when the relative performance of Low P/B versus the S&P 500 peaked. Since then Low P/B has cumulatively underperformed the S&P 500 by 2,000 bp.
PAST CYCLES IMPLY THAT THE TURN IS NEAR
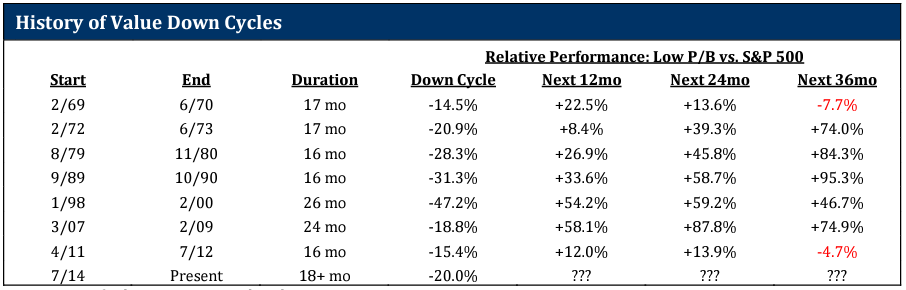
The current underperformance of “real” value is not a unique event. Over the last 55 years, there have been seven other periods where Low P/B has experienced a significant run of underperformance. The table below summarizes the past down cycles for Low P/B relative performance, and we make several observations.
One thing we notice is that these down cycles have lasted in duration from sixteen to twenty-six months. The current down cycle has already lasted about eighteen months. If the past is any guide for the future, the turn for the next up cycle should occur sometime in the next few months.
 Source: Sanford Bernstein; Lyrical analytics
Another thing we notice is that down cycles for value have occurred during up markets, down markets and flat markets. There is nothing about the direction of the market that drives the underperformance of value investing, nor are we able to detect any macro or market signal that indicates the start or end of these value investing cycles.
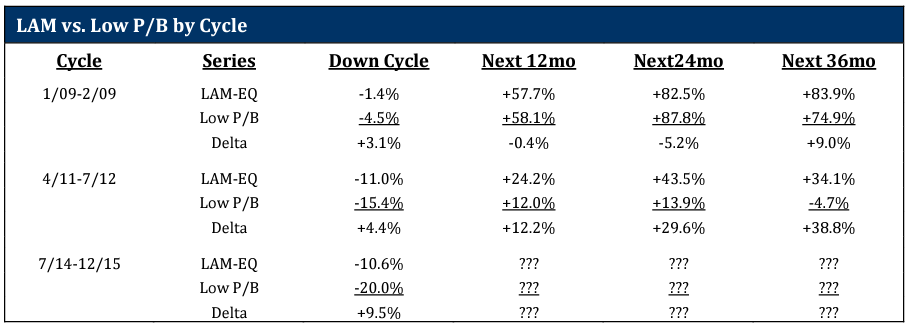
RECOVERY HISTORICALLY HAS BEEN FAST AND STEEP
Lastly, we notice that when the down cycle ends, the recovery has been fast and steep. Most, if not all, of the underperformance has been recovered in the first twelve months of the following up cycle, and significant additional outperformance has been recorded in years two and three. However, we have seen two up cycles cut short by the early onset of a new down cycle.
The most recent up cycle recovery from the 2011-12 down cycle was one that was cut short. This also happened when the recovery from the 1969-70 down cycle was cut short by the 1972-73 down cycle. What followed that second down cycle was a six year run from 1973 to 1979 where Low P/B outperformed the S&P 500 by 176.4%, or 1,580 bp per annum. Only time will tell what follows this current cycle, but based on the historical record, we have high expectations.
LYRICAL IMPROVED UPON LOW P/B
At Lyrical, our investment approach is more sophisticated than just creating an equally weighted portfolio of low P/B stocks. We manage a concentrated portfolio of carefully selected stocks that are deeply undervalued based on their expected future earnings and also are relatively easy to analyze and understand, quality businesses. The benefits of this approach are apparent when comparing our net returns to that of the Low P/B series.
When value is out of favor and Low P/B underperforms, our product has also underperformed, but by a smaller margin. By muting the underperformance during value style down cycles, we believe we have taken some of the “potholes” out of “real” value investing.
 Source: Sanford Bernstein; Lyrical analytics
Furthermore, our product has also been able to capture more upside in the recoveries. In the first recovery period starting in March 2009, after 36 months we outperformed Low P/B by 900 bp. In the second recovery period starting in August 2012, we outperformed Low P/B by 3,880 bp.
CONCLUSION
We have been managing client capital for seven years, producing a long term record of success that is best-in-class. This year was disappointing. We are realistic and know that our process is not designed to outperform every year, but rather is designed to maximize long term performance. Still, it never feels good to underperform.
Our approach is fundamental value investing, and there are periods where that approach is not rewarded. We take some comfort in knowing that we have been able both to mute downside when value is out of favor and to capture more upside when value is in favor, as it is most of the time.
While value investing has been out of favor of late, we do not believe this is a sign that the strategy no longer works. There have been several periods in the past where, like today, value investing has been out of favor. These have proved to be temporary setbacks, leading to periods of strong outperformance. We do not see any reason why this current period should be any different, and, in fact, we see as much upside potential in the portfolio today as at any other time since late 2009.
THIS IS NOT AN OFFERING OR THE SOLICITATION OF AN OFFER TO INVEST IN THE STRATEGY PRESENTED. ANY SUCH OFFERING CAN ONLY BE MADE FOLLOWING A ONE-ON-ONE PRESENTATION, AND ONLY TO QUALIFIED INVESTORS IN THOSE JURISDICTIONS WHERE PERMITTED BY LAW.
THERE IS NO GUARANTEE THAT THE INVESTMENT OBJECTIVE OF THE STRATEGY WILL BE ACHIEVED. RISKS OF AN INVESTMENT IN THIS STRATEGY INCLUDE, BUT ARE NOT LIMITED TO, THE RISKS OF INVESTING IN EQUITY SECURITIES GENERALLY, AND IN A VALUE INVESTING APPROACH, MORE SPECIFICALLY. MOREOVER, PAST PERFORMANCE SHOULD NOT BE CONSTRUED AS AN INDICATOR OF FUTURE PERFORMANCE.
THE S&P 500 INDEX IS A MARKET CAPITALIZATION WEIGHTED INDEX COMPRISED OF 500 WIDELY-HELD COMMON STOCKS.
THE RUSSELL 1000 VALUE INDEX MEASURES THE PERFORMANCE OF THE LARGE-CAP VALUE SEGMENT OF THE U.S. EQUITY UNIVERSE. IT INCLUDES THOSE RUSSELL 1000 COMPANIES WITH LOWER PRICE-TO-BOOK RATIOS AND LOWER EXPECTED GROWTH VALUES. THE RUSSELL 1000 VALUE INDEX IS CONSTRUCTED TO PROVIDE A COMPREHENSIVE AND UNBIASED BAROMETER FOR THE LARGE-CAP VALUE SEGMENT. THE INDEX IS COMPLETELY RECONSTITUTED ANNUALLY TO ENSURE NEW AND GROWING EQUITIES ARE INCLUDED AND THAT THE REPRESENTED COMPANIES CONTINUE TO REFLECT VALUE CHARACTERISTICS.
ADDITIONAL INFORMATION REGARDING LAM –U.S. VALUE EQUITY-CS:
PERFORMANCE FIGURES PRIOR TO AUGUST 2013 REFLECT THE MODEL, HYPOTHETICAL RESULTS FOR A HYPOTHETICAL PORTFOLIO PURSUING THE MARKET CAPITALIZATION WEIGHTED INVESTMENT GUIDELINES (THE “GUIDELINES”) DESCRIBED BELOW, AND DO NOT REPRESENT RETURNS OF ACTUAL INVESTMENTS MADE. THERE ARE A VARIETY OF LIMITATIONS INHERENT IN MODEL RESULTS. TRANSACTION EXPENSES HAVE BEEN INCLUDED AT FIVE CENTS PER SHARE, TO REFLECT COMMISSIONS AND EXPECTED MARKET IMPACT. DIVIDENDS HAVE BEEN INCLUDED IN THE RETURNS. LAM’S CLIENTS HAD RESULTS THAT WERE MATERIALLY DIFFERENT FROM THOSE PORTRAYED IN THE MODEL.
MARKET CAPITALIZATION WEIGHTED INVESTMENT GUIDELINES
LAM’S ORIGINAL, U.S. VALUE EQUITY – EQ IS AN APPROXIMATELY 34 STOCK PORTFOLIO THAT IS EQUAL WEIGHTED AT COST TO TARGET 99% INVESTED WITH 1% CASH, HENCE APPROXIMATELY 3% PER POSITION. WE HAVE PICKED A BENCHMARK CAPITALIZATION LEVEL (THE “CAPITALIZATION BENCHMARK”) EQUAL TO $11.2BN AS OF DECEMBER 31, 2013 AND EQUAL TO $11.2BN MULTIPLIED BY THE QUOTIENT DERIVED BY DIVIDING THE LEVEL OF THE S&P 500 INDEX® AT ALL OTHER TIMES BY 1,848.36 (THE CLOSING PRICE OF THAT INDEX ON DECEMBER 31, 2013).
TO REFLECT A PORTFOLIO THAT HAS GREATER LIQUIDITY, WE CREATED A MODEL PORTFOLIO WITH MODIFIED PORTFOLIO POSITION WEIGHTS.
- STOCKS WITH A MARKET CAPITALIZATION GREATER THAN THE CAPITALIZATION BENCHMARK HAVE BEEN MADE EQUAL WEIGHTED FULL POSITIONS.
- STOCKS WITH A MARKET CAPITALIZATION LESS THAN THE CAPITALIZATION BENCHMARK HAVE HAD THEIR POSITION WEIGHTS SCALED IN PROPORTION TO THEIR MARKET CAP.
FOR EXAMPLE, A STOCK WITH A $5.6BN MARKET CAPITALIZATION AS OF DECEMBER 31, 2013 WOULD HAVE BEEN GIVEN AN INITIAL PORTFOLIO WEIGHT OF 0.5X A FULL POSITION. A STOCK WITH A $3.4BN MARKET CAPITALIZATION AS OF DECEMBER 31, 2013 WOULD HAVE BEEN GIVEN AN INITIAL PORTFOLIO WEIGHT OF 0.3X A FULL POSITION.
WITH LESS CAPITAL ALLOCATED TO THE LESS LIQUID STOCKS, WE HAVE GROSSED UP THE SIZE OF A FULL POSITION FROM THE CURRENT 2.9% IN THE EQUAL WEIGHTED ORIGINAL PORTFOLIO TO APPROXIMATELY 3.8% IN THE HYPOTHETICAL MARKET CAPITALIZATION WEIGHTED PORTFOLIO, TO ACHIEVE A MODEL PORTFOLIO WITH 99% INVESTED IN STOCKS AND 1% CASH.
PERFORMANCE ESTIMATION METHODOLOGY
TO ESTIMATE THE HISTORICAL PERFORMANCE OF THE U.S. VALUE EQUITY–CS, MARKET CAPITALIZATION WEIGHTED PORTFOLIO, WE APPLIED THE METHODOLOGY DESCRIBED ABOVE TO THE STOCKS IN OUR ORIGINAL U.S. VALUE EQUITY-EQ PORTFOLIO OF DECEMBER 31, 2008.
WE MODELED THAT ALL PURCHASES OF NEW HOLDINGS AND EXITS FROM EXISTING HOLDINGS THAT TOOK PLACE DURING A MONTH IN OUR ACTUAL PORTFOLIOS TOOK PLACE AS OF THE END OF THAT MONTH IN THE BACKTEST MODEL.
IN MONTHS WHERE CASH WAS NEEDED BECAUSE THE SIZE OF THE PURCHASED STOCK EXCEEDED THE PROCEEDS FROM THE STOCK SOLD, WE MODELED THAT WE TRIMMED THE LARGEST POSITION (AT MARKET) IN THE PORTFOLIO TO GENERATE ENOUGH CASH TO COVER THE DIFFERENCE.
IN MONTHS WHERE THE CASH POSITION ROSE TO LEVELS ABOVE 1% WE DID NOT REINVEST THE EXTRA CASH.
THESE MODEL RESULTS ARE UNAUDITED AND SUBJECT TO REVISION AND SHOW ALL PERIODS BEGINNING WITH THE FIRST FULL MONTH IN WHICH THE ADVISOR MANAGED ITS FIRST FEE-PAYING ACCOUNT. HYPOTHETICAL NET RETURNS INCLUDE A 1.25% BASE FEE.