In 2016, the U.S. Value Equity-EQ and U.S. Value Equity-CS composites produced gross returns of +16.0% (+15.1% net) and +16.3% (+14.9% net), respectively. Comparatively, the S&P 500 and Russell 1000 Value produced total returns of +12.0% and +17.3%, respectively.
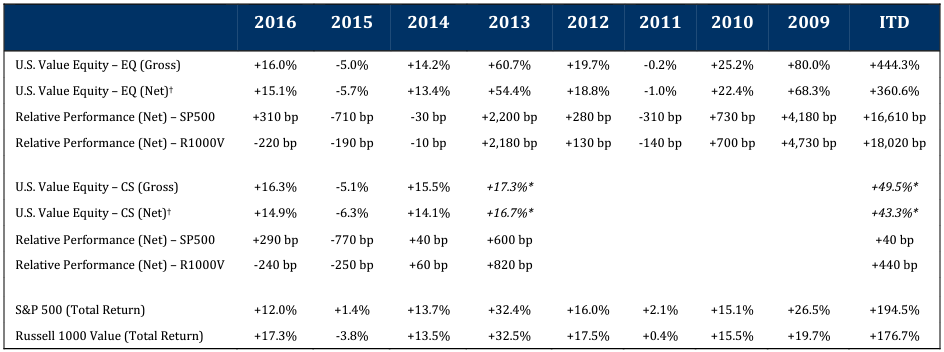
*Partial period shown beginning August 1, 2013. †Net returns methodology is detailed below.
The year 2016 turned out to be a good one, which is a bit hard to believe given how it started. Back in January and early February, the markets were in a steep decline. Then on February 11th, the markets bottomed and began to march upward, finishing the year near their high. The ride was far from smooth, with notable dips around Brexit in June and in the weeks leading up to the election in November. But, when all was said and done, we finished the year up ~15% net, roughly 300bp ahead of the S&P 500.
In analyzing our portfolio’s performance attribution, we find it helpful to examine both the investment success rate and any skew in the distribution of returns. In 2016, 73% of our investments posted gains, and 62% outperformed the S&P 500. Since inception, 83% of our investments have posted gains, and 67% have outperformed the S&P 500.
Skew was not a material factor in 2016, as our outperformers outperformed by 17% while our underperformers underperformed by a similar 18%.
Portfolio turnover was 12.0% over the last twelve months, and since inception it stands at 15.0% annualized. During the year, we sold four stocks and purchased four replacements. There are four different reasons why we sell a stock: 1) the stock approaches our estimate of fair value, 2) the stock is acquired, 3) we lose conviction in the company, or 4) we find a superior substitute. In 2016, it just so happens that we sold one stock for each of these four reasons.
LOOKING FORWARD
The P/E ratio for our portfolio on forward consensus earnings estimates was 12.4x at the end of 2016. The S&P 500 had a valuation of 17.3x on this same basis, a premium of 40%. Historically, the average premium of the S&P 500 to our portfolio is ~25%. The current premium of 40% is near a historical high. The only time the premium has been greater was earlier in 2016 and at the end of 2Q12. We believe this bodes well for the ability of the portfolio to meaningfully outperform the S&P 500 going forward.
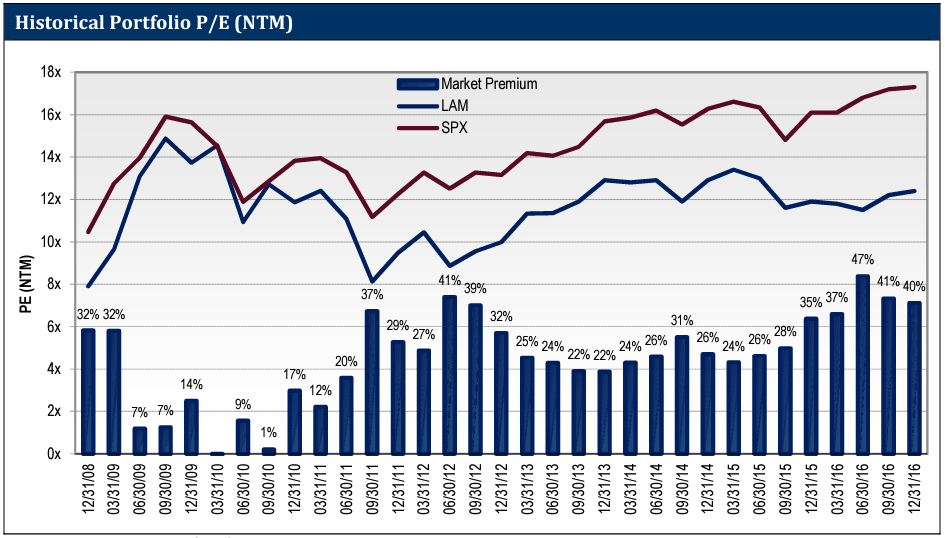
Source: FactSet; Lyrical analytics
EVESTMENT PEER COMPARISON
Lyrical remains the top performing manager amongst our broad, value-style peer group. We use eVestment’s database to compare our returns to the returns of all Large Cap, Mid Cap and All Cap Value products. While not all of these products are our true peers, we want to cast a wide net in capturing the performance data. In total, as of January 24, 2017, there are 530 products in those three categories that reported returns for all years since our 2009 inception. Lyrical Asset Management’s U.S. Value Equity-EQ ranks as the product with the highest return for that period in that assembled, superset universe. Additionally, our U.S. Value Equity–CS product ranks as the next highest returning product (second only to EQ) in the Large Cap universe, and in the top 1% of that superset universe over the same time period.
For the year 2016, the U.S. Value Equity-EQ and U.S. Value Equity-CS composites ranked in the 39th and 43rd percentiles of 645 products in the database, respectively.
(Note that eVestment uses gross performance for
such rankings.)
REVISITING ACTIVE SHARE
In our 2010 and 2012 letters we cited the work of Professor Martjin Cremers on 9ctive Share and fund performance. With the release of a new academic paper, “Active Share and the Three Pillars of Active Management: Skill, Conviction and Opportunity,” we would like to revisit the subject of Active Share and relay some of the new findings in Professor Cremers’ work.
Recall, Active Share measures the percentage of a fund’s portfolio that deviates from a benchmark. For example, an Active Share measure of 0% means the portfolio is an exact clone of a benchmark, while a measure of 100% means there is no overlap with the benchmark at all. Active Share is of critical importance for fund performance. We believe it is a self-evident truth that, to beat a benchmark, a fund must differ from that benchmark. Thus, high Active Share is a necessary but not sufficient condition for outperformance. If a fund meaningfully differs from a benchmark, it can do much better or much worse, but if it hugs a benchmark too closely, it has little chance of generating alpha.
NO ALPHA IN LARGE CAPS?
In Professor Cremers latest paper, he analyzed 25 years of mutual fund performance (1990-2015). There is a lot of data and analyses in the paper, but we would like to focus on the findings for Large Cap funds. This area is of particular interest because we encounter many investors who believe that alpha cannot be found in large caps, and have resorted to passive strategies in this space. They are not entirely wrong in their belief, as the vast majority of large cap funds do not outperform their benchmarks over time. There is, however, one group of funds that does outperform its benchmarks on average, namely funds in the top quintile of Active Share. The highest Active Share quintile has demonstrated outperformance on average, producing 68bp of alpha. The other 80% of large cap funds have significantly underperformed by an average of over 100bp, as shown in the chart below.
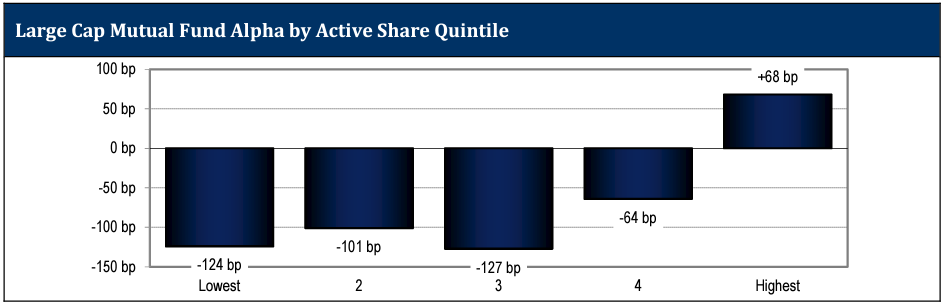
Source: “Active Share and the Three Pillars of Active Management,” Martjin Cremers, December 2016
BE ACTIVE, BUT NOT ACTIVE
These findings demonstrate that funds can deliver alpha when they are truly active in their exposures relative to their benchmark. What about the other kind of “active”, i.e. active trading? In addition to Active Share, this latest study also examines the role of holding periods and fund performance. When sorting large cap funds based on the duration of their holdings, there was not a clear performance benefit to highly active funds with short holding durations or inactive funds with long holding durations. In fact, every quintile of holding duration underperformed its benchmark on average. While the least active funds (those in the quintile of funds with the longest holding durations) performed the best, they still on average underperformed their benchmarks by 32bp.
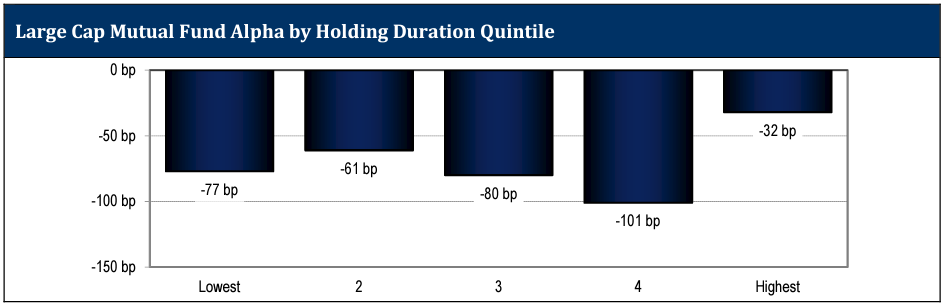
Source: “Active Share and the Three Pillars of Active Management,” Martjin Cremers, December 2016
The picture changes when you focus on the highest Active Share managers. For this outperforming group, the least active traders with the longest holding durations performed significantly better than their more actively trading peers. Specifically, high Active Share managers with the longest holding durations outperformed their benchmark by 240bp on average, whereas the remainder of the high Active Share quintile averaged less than 30bp of outperformance.
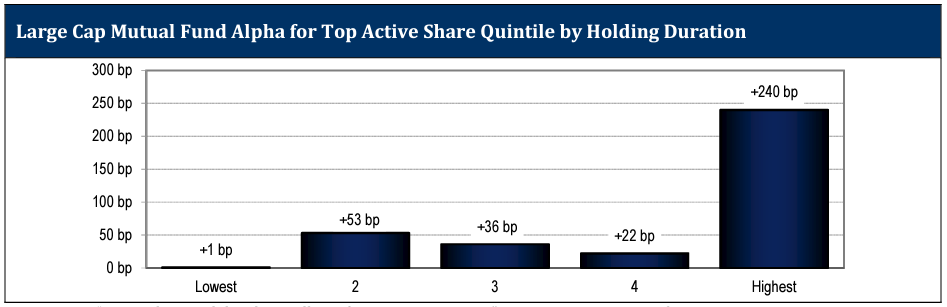
Source: “Active Share and the Three Pillars of Active Management,” Martjin Cremers, December 2016
While high Active Share and long holding duration are not guarantees of success, they are two valuable filters investors can use to narrow down the vast fund universe to identify those funds in the best position to perform. By the way, Lyrical’s managed accounts have had an Active Share of ~97%, and an average holding duration of 7+ years. Not only do these metrics place us in the top quintile for both Active Share and holding duration, but we rank as having one of the highest Active Share and longest holding duration funds in the fund universe.
IT'S NOT A FAIR FIGHT
We believe our exceptionally high 97% Active Share provides us a structural advantage over our peers. For example, if we had the same stock picking skill as another fund, but that other fund had 80% Active Share instead of our 97%, we have the advantage of having 20% more of our portfolio (97%/80%) differing from the benchmark, and therefore available to contribute to outperformance. Compared to a fund with only 70% or 60% Active Share, we have ~40% or ~60% more of our portfolio available to contribute to outperformance. Put another way, unless a lower Active Share competitor has a significant stock picking skill advantage over us (which WE certainly believe they do NOT), they have less chance of being able to deliver the kind of outperformance we could.
THE PROBLEM WITH ACTIVE MANAGEMENT
On January 7, 2017 CNBC published an article about what a terrible year 2016 was for stock picking. While our portfolio outperformed the S&P 500 by several hundred basis points, the article stated that only 18% of large-cap active managers beat the S&P 500 for the year. It is getting to the point where active equity managers failing to beat market benchmarks is no longer news. The persistent disappointments from active managers is driving money into passive funds and ETFs. Over the twelve months through November 2016, investors pulled $258 billion from actively managed funds and injected $217 billion into passive funds, according to Morningstar data.
Despite the self-evident truth that to beat a benchmark a fund must differ from that benchmark, and despite the compelling data that high Active Share managers are the only group to outperform their benchmarks, the industry has moved away from high Active Share. Do you remember 1983? Ronald Reagan was president. M*A*S*H aired its final episode. “Return of the Jedi” was the latest Star Wars movie, and Michael Jackson’s “Thriller” album topped the charts. And in 1983, 68% of large cap mutual fund assets were in funds with 80%+ Active Share. 31% of large cap mutual fund assets were in funds with 90%+ Active Share!
In the 30+ years since then, the industry has dramatically retreated from high Active Share. As of 2015, only 16% of large cap mutual fund assets are in 80%+ Active Share funds, and merely 3.9% of large cap assets are in funds with 90%+ Active Share. Given the rarity of highly active large cap funds, we believe that the struggles of the active management industry are structural and unlikely to improve, even if future years turn out to be better for stock picking.
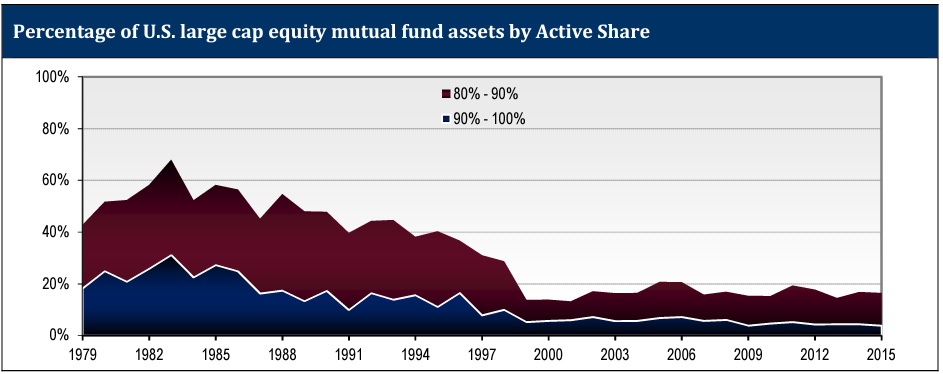
Source: “Active Share and the Three Pillars of Active Management,” Martjin Cremers, December 2016
ACTIVE MANAGEMENT FEES
Given the poor performance of actively managed funds, the industry has experienced growing fee pressure. All else equal, low fees are better for investors than high fees. However, all else is not equal. What is more important than the absolute level of fees is what investors get for the fees they pay. A related measure to Active Share is a metric called Active Fee. Since the part of a portfolio that overlaps with the market cannot add value (i.e. outperformance), it is not something fund investors should pay for. Rather, fund investors should look at the fee they pay for the entire fund and divide it by the percentage of the fund that differs from the market – its Active Share.
This Active Fee calculation is a better indicator of what an investor is really paying. For example, a hypothetical fund has an expense ratio of 1.37% and an active share of 97.5%. The Active Fee of that fund is 1.41% (1.37%/97.5%). Another fund might appear to be highly active with an active share of 80%, and that fund might appear less expensive with an expense ratio of 1.25%. However, when you calculate the Active Fee, what appears less expensive is actually more expensive, as an investor would be paying 1.56%
(1.25%/80%) for the active portion of that portfolio. Even a fund with a low expense ratio of just 0.85% would have a higher Active Fee than the first fund if its Active Share was below 60%.
Often the funds with the lowest stated fees have the lowest levels of Active Share, and their investors lose two ways. First, they end up paying high fees for the active portion of the fund. Second, as we showed above, low Active Share funds underperform on average. Professor Cremers has set up a website at
www.ActiveShare.info where you can look up the Active Share and Active Fee of almost any mutual fund.
CONCLUSION
We have been managing client capital for eight years, producing a long-term record of success that is best-in-class.
This year was another solid year of delivering returns in excess of the broader market.
This year was another solid year of delivering returns in excess of the broader market.
While we are satisfied with our 2016 results, we are truly excited about the prospects for 2017. As shown above, the valuation spread between our portfolio and the market is near historic highs. Momentum also appears to be on our side, as the down cycle for value stocks seems to have ended in February 2016. Historically, most up cycles for value stocks last six to nine years, and we are just about one year into what appears to be a new up cycle. This combination of wide valuation spreads and value stock momentum is fueling our optimism for 2017 and the years that follow. Admittedly this is informed guesswork, so take it with how many grains of salt you like, but it is our best insight into what to expect.
THIS IS NOT AN OFFERING OR THE SOLICITATION OF AN OFFER TO INVEST IN THE STRATEGY PRESENTED. ANY SUCH OFFERING CAN ONLY BE MADE FOLLOWING A ONE-ON-ONE PRESENTATION, AND ONLY TO QUALIFIED INVESTORS IN THOSE JURISDICTIONS WHERE PERMITTED BY LAW.
THERE IS NO GUARANTEE THAT THE INVESTMENT OBJECTIVE OF THE STRATEGY WILL BE ACHIEVED. RISKS OF AN INVESTMENT IN THIS STRATEGY INCLUDE, BUT ARE NOT LIMITED TO, THE RISKS OF INVESTING IN EQUITY SECURITIES GENERALLY, AND IN A VALUE INVESTING APPROACH, MORE SPECIFICALLY. MOREOVER, PAST PERFORMANCE SHOULD NOT BE CONSTRUED AS AN INDICATOR OF FUTURE PERFORMANCE.
THE S&P 500 INDEX IS A MARKET CAPITALIZATION WEIGHTED INDEX COMPRISED OF 500 WIDELY-HELD COMMON STOCKS.
THE RUSSELL 1000 VALUE INDEX MEASURES THE PERFORMANCE OF THE LARGE-CAP VALUE SEGMENT OF THE U.S. EQUITY UNIVERSE. IT INCLUDES THOSE RUSSELL 1000 COMPANIES WITH LOWER PRICE-TO-BOOK RATIOS AND LOWER EXPECTED GROWTH VALUES. THE RUSSELL 1000 VALUE INDEX IS CONSTRUCTED TO PROVIDE A COMPREHENSIVE AND UNBIASED BAROMETER FOR THE LARGE-CAP VALUE SEGMENT. THE INDEX IS COMPLETELY RECONSTITUTED ANNUALLY TO ENSURE NEW AND GROWING EQUITIES ARE INCLUDED AND THAT THE REPRESENTED COMPANIES CONTINUE TO REFLECT VALUE CHARACTERISTICS.
ADDITIONAL INFORMATION REGARDING LAM –U.S. VALUE EQUITY-CS:
PERFORMANCE FIGURES PRIOR TO AUGUST 2013 REFLECT THE MODEL, HYPOTHETICAL RESULTS FOR A HYPOTHETICAL PORTFOLIO PURSUING THE MARKET CAPITALIZATION WEIGHTED INVESTMENT GUIDELINES (THE “GUIDELINES”) DESCRIBED BELOW, AND DO NOT REPRESENT RETURNS OF ACTUAL INVESTMENTS MADE. THERE ARE A VARIETY OF LIMITATIONS INHERENT IN MODEL RESULTS. TRANSACTION EXPENSES HAVE BEEN INCLUDED AT FIVE CENTS PER SHARE, TO REFLECT COMMISSIONS AND EXPECTED MARKET IMPACT. DIVIDENDS HAVE BEEN INCLUDED IN THE RETURNS. LAM’S CLIENTS HAD RESULTS THAT WERE MATERIALLY DIFFERENT FROM THOSE PORTRAYED IN THE MODEL.
MARKET CAPITALIZATION WEIGHTED INVESTMENT GUIDELINES
LAM’S ORIGINAL, U.S. VALUE EQUITY – EQ IS AN APPROXIMATELY 34 STOCK PORTFOLIO THAT IS EQUAL WEIGHTED AT COST TO TARGET 99% INVESTED WITH 1% CASH, HENCE APPROXIMATELY 3% PER POSITION. WE HAVE PICKED A BENCHMARK CAPITALIZATION LEVEL (THE “CAPITALIZATION BENCHMARK”) EQUAL TO $11.2BN AS OF DECEMBER 31, 2013 AND EQUAL TO $11.2BN MULTIPLIED BY THE QUOTIENT DERIVED BY DIVIDING THE LEVEL OF THE S&P 500 INDEX® AT ALL OTHER TIMES BY 1,848.36 (THE CLOSING PRICE OF THAT INDEX ON DECEMBER 31, 2013).
TO REFLECT A PORTFOLIO THAT HAS GREATER LIQUIDITY, WE CREATED A MODEL PORTFOLIO WITH MODIFIED PORTFOLIO POSITION WEIGHTS.
- STOCKS WITH A MARKET CAPITALIZATION GREATER THAN THE CAPITALIZATION BENCHMARK HAVE BEEN MADE EQUAL WEIGHTED FULL POSITIONS.
- STOCKS WITH A MARKET CAPITALIZATION LESS THAN THE CAPITALIZATION BENCHMARK HAVE HAD THEIR POSITION WEIGHTS SCALED IN PROPORTION TO THEIR MARKET CAP.
FOR EXAMPLE, A STOCK WITH A $5.6BN MARKET CAPITALIZATION AS OF DECEMBER 31, 2013 WOULD HAVE BEEN GIVEN AN INITIAL PORTFOLIO WEIGHT OF 0.5X A FULL POSITION. A STOCK WITH A $3.4BN MARKET CAPITALIZATION AS OF DECEMBER 31, 2013 WOULD HAVE BEEN GIVEN AN INITIAL PORTFOLIO WEIGHT OF 0.3X A FULL POSITION.
WITH LESS CAPITAL ALLOCATED TO THE LESS LIQUID STOCKS, WE HAVE GROSSED UP THE SIZE OF A FULL POSITION FROM THE CURRENT 2.9% IN THE EQUAL WEIGHTED ORIGINAL PORTFOLIO TO APPROXIMATELY 3.8% IN THE HYPOTHETICAL MARKET CAPITALIZATION WEIGHTED PORTFOLIO, TO ACHIEVE A MODEL PORTFOLIO WITH 99% INVESTED IN STOCKS AND 1% CASH.
PERFORMANCE ESTIMATION METHODOLOGY
TO ESTIMATE THE HISTORICAL PERFORMANCE OF THE U.S. VALUE EQUITY–CS, MARKET CAPITALIZATION WEIGHTED PORTFOLIO, WE APPLIED THE METHODOLOGY DESCRIBED ABOVE TO THE STOCKS IN OUR ORIGINAL U.S. VALUE EQUITY-EQ PORTFOLIO OF DECEMBER 31, 2008.
WE MODELED THAT ALL PURCHASES OF NEW HOLDINGS AND EXITS FROM EXISTING HOLDINGS THAT TOOK PLACE DURING A MONTH IN OUR ACTUAL PORTFOLIOS TOOK PLACE AS OF THE END OF THAT MONTH IN THE BACKTEST MODEL.
IN MONTHS WHERE CASH WAS NEEDED BECAUSE THE SIZE OF THE PURCHASED STOCK EXCEEDED THE PROCEEDS FROM THE STOCK SOLD, WE MODELED THAT WE TRIMMED THE LARGEST POSITION (AT MARKET) IN THE PORTFOLIO TO GENERATE ENOUGH CASH TO COVER THE DIFFERENCE.
IN MONTHS WHERE THE CASH POSITION ROSE TO LEVELS ABOVE 1% WE DID NOT REINVEST THE EXTRA CASH.
THESE MODEL RESULTS ARE UNAUDITED AND SUBJECT TO REVISION AND SHOW ALL PERIODS BEGINNING WITH THE FIRST FULL MONTH IN WHICH THE ADVISOR MANAGED ITS FIRST FEE-PAYING ACCOUNT. HYPOTHETICAL NET RETURNS INCLUDE A 1.25% BASE FEE.