In 2017, the U.S. Value Equity-EQ and U.S. Value Equity-CS composites produced gross returns of +19.0% (+18.1% net) and +22.7% (+21.3% net), respectively. Comparatively, the S&P 500 and Russell 1000 Value produced total returns of +21.8% and +13.7%, respectively.
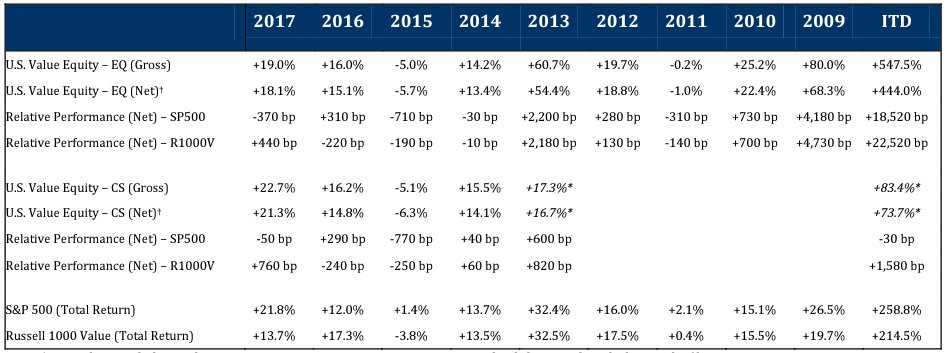
*Partial period shown beginning August 1, 2013. †Net returns methodology is detailed at end of letter.
2017 was a strong year for the overall US equity market, with the S&P 500 producing a total return of 21.8%. The Russell 1000 Value index had a decent year, producing a total return of 13.7%, but significantly lagging the S&P 500. We have observed a back-and-forth battle between growth and value over the last three years. In 2015, the Russell 1000 Value index underperformed the Russell 1000 Growth index by 950bp, its 9th worst relative year in the 39-year history of those indices. The value index rebounded in 2016 and outperformed the growth index by 1,030bp, its 10th best relative year. In 2017, it flipped again, and the value index underperformed the growth index by 1,650bp, its 5th worst relative year. The significant underperformance of value stocks in 2017 was a strong headwind for Lyrical’s deep value approach, but our emphasis on quality was able to overcome this headwind and produce returns well above the Russell 1000 Value, and close to the S&P 500.
In analyzing our portfolio’s performance attribution, we find it helpful to examine both the investment success rate and any skew in the distribution of returns. In 2017, 78% of our investments posted gains, and 47% outperformed the S&P 500. Since inception, 83% of our investments have posted gains, and 63% have outperformed the S&P 500.
Skew was a negative factor on an unweighted basis in 2017, as our outperformers outperformed the S&P 500 by 13% while our underperformers underperformed by 19%.
Portfolio turnover was 9.0% over the last twelve months, and since inception it stands at 14.4% annualized. During the year, we sold three stocks and purchased three replacements. All three sales were due to the stocks approaching our estimate of fair value.
LOOKING FORWARD
The P/E ratio for our portfolio on forward consensus earnings estimates was 12.8x at year-end. The S&P 500 had a valuation of 18.4x on this same basis, a historically wide premium of 44%. To put this in context, over our firm history, the S&P 500 has had an average P/E premium to our portfolio of ~25%. In the past, when the valuation spread has exceeded 40%, subsequent outperformance has been greater than our long-term average.
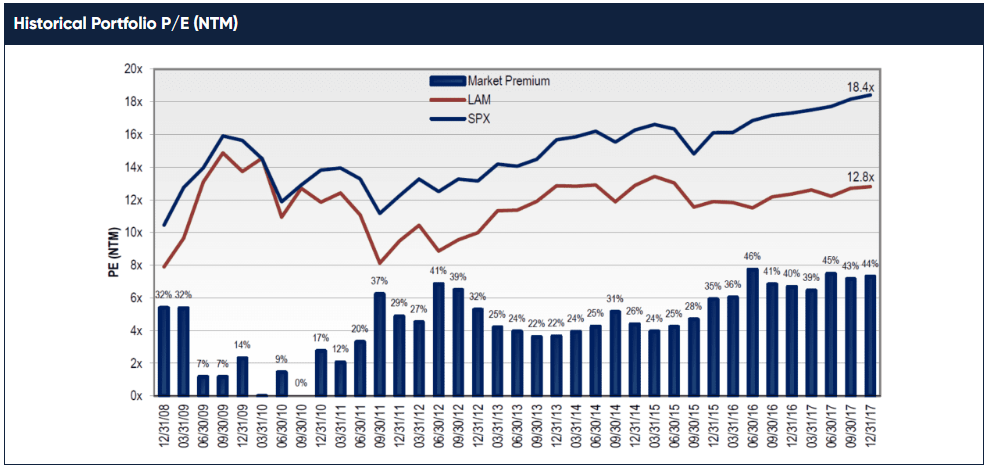
Source: FactSet; Lyrical analytics
EVESTMENT PEER COMPARISON
Lyrical remains the top performing manager amongst our broad, value-style peer group. We use eVestment’s database to compare our returns to the returns of all Large Cap, Mid Cap and All Cap Value products. While not all of these products are our true peers, we want to cast a wide net in capturing the performance data. In total, as of January 30, 2018, there are 530 products in those three categories that reported returns for all years since our 2009 inception. For that superset universe, the U.S. Value Equity-EQ composite ranks in the top 1%. Additionally, for the past 5 years and 7 years, our composite also ranks in the top 1% of that universe.
For 2017, the U.S. Value Equity-EQ and U.S. Value Equity-CS composites ranked in the 21st and 7th percentiles of 653 products in the database, respectively.
(Note that eVestment uses gross performance for
such rankings.)
IS LARGE CAP ACTIVE MANAGEMENT DIFFICULT?
Consider this perplexing paradox. On the one hand, the S&P 500 should not be that difficult to outperform. The index does not select its constituents based on investment merit. Instead, it essentially picks the 500 largest and most liquid stocks in the market, and weighs these positions based on their size. Surely, such a simple index construction process should be easy to pick apart and outperform.
On the other hand, for decades active managers have been trying to do just that, and the clear majority have failed at the task. This begs the question, is the S&P 500 mysteriously hard to beat, or are large cap active managers doing something systemically wrong? To explore this question, we analyzed the top 1,000 stocks in the US market going back 20 years. We wanted to see how many stocks in that universe outperformed the S&P 500 (i.e. the underlying batting average of the market). Or put another way, if you were to select stocks at random, what were the chances of selecting outperformers? We went beyond the constituents of the S&P 500 to the top 1,000 to add breadth and robustness to the analysis.
We discovered that outperformance in the large cap space has not been difficult over the last 20 years and did not even require stock picking skill. All that would have been required was a longer holding period (5 years) and avoiding the largest stocks (mega caps). If a manager did just those two things, over these 20 years, a randomly constructed stock portfolio would have been likely to outperform the S&P 500 without any stock picking skill but rather purely by chance.
HOW MANY STOCKS IN THE MARKET OUTPERFORM?
We created a universe of the top 1,000 stocks in the US market for each of the last 20 years. We then counted how many of the stocks in each annual universe outperformed the S&P 500 for that year. When we tallied the data, the results were as expected. Over this 20-year span, about 50% of the stocks outperformed. The results were interesting because we could see which years had a high number of outperforming stocks and thus were favorable for stock picking, and which years had a low number and were difficult. The internet bubble years were particularly difficult for stock picking with just 27% and 31% of stocks outperforming in 1998 and 1999, respectively. The seven years after the bubble, from 2000 to 2006 were very favorable with 58% outperforming on average. Recently, 2017 and 2015 were difficult years at 42% and 45%, respectively, while 2010 was favorable at 59%. (All the other years in this 20-year period were within a few percentage points of 50%.)
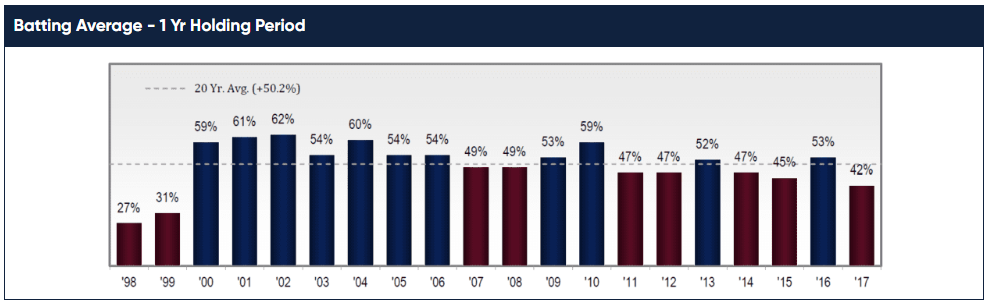
Source: FactSet; Lyrical analytics
LONGER HOLDING PERIODS IMPROVED THE ODDS
It is our belief that one year is not long enough to properly evaluate a stock. In our personal experience, we have seen stocks ignored by the market for several years and then rise significantly in a short period of time. Such stocks might outperform greatly over a five-year period but underperform in most of those five years. Due to the fickleness of this timing, we believed that more stocks may outperform over a five-year period than a one-year period.
We tested this belief using the same 20-year data set of the top 1,000 stocks. We calculated the percentage of stocks that outperformed over a five-year holding period. As we suspected, a greater percentage of stocks outperformed with a five-year holding period. While just 50% of stocks outperformed with a one-year hold, 54% outperformed over a five-year hold. Thus, holding stocks for five years materially improved the odds that a selected stock outperformed the S&P 500.
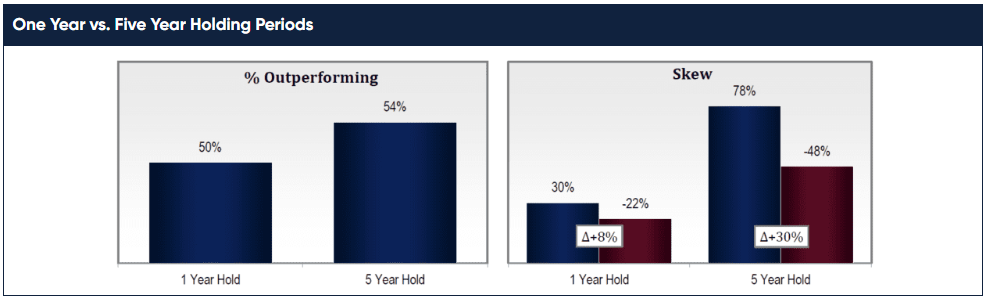
Source: FactSet; Lyrical analytics
While a five-year holding period improved the odds, a 54% outperformance rate may seem only a slight edge. That edge is further enhanced, though, when you include the impact of skew. Skew is the imbalance between the degree that outperformers outperform relative to the degree underperformers underperform. On a one-year hold basis, the 50% of stocks that outperformed did so by an average of 30%, while the 50% that underperformed did so by an average of 22% for a net difference of +8%. On a five-year hold basis, the 54% of stocks that outperformed did so by an average of 78%, while the 46% that underperformed did so by an average of 48% for a net difference of +30%. Putting these two factors together we see that a portfolio of randomly selected stocks that was simply bought and held for five years would have been expected to outperform the S&P 500, as more than half the stocks in that portfolio would have been likely to outperform, and the winners would have been more significant than the losers.
MALKIEL'S MONKEY
Other academic research, such as Arnott’s Malkiel’s Monkey paper, confirms this conclusion about the outperformance of random portfolios. In his bestselling book, A Random Walk Down Wall Street, Burton Malkiel said, “a blindfolded monkey throwing darts at a newspaper’s financial pages could select a portfolio that would do just as well as one carefully selected by experts.” Our analysis of batting average and skew of the top 1,000 stocks over the last 20 years supports this assertion about Malkiel’s monkey. In 2013 the Journal of Portfolio Management published a paper by Rob Arnott et al called “The Surprising Alpha From Malkiel’s Monkey and Upside-Down Strategies.” Part of this paper was an expansive analysis of the performance of randomly selected 30 stock portfolios over a 49-year period of 1964-2012 from a universe of the top 1,000 stocks. Amazingly, they showed that out of 100 randomly created portfolios, 96 matched or beat the capitalization weighted portfolio. The random portfolios on average outperformed by 160bp per annum (11.26% vs. 9.66%) and had a CAPM alpha that was large and verged on statistical significance. Thus, they concluded that Malkiel was too modest. A blindfolded monkey does not do just as well as experts, it does much better! (Although we still don’t understand why the monkey needs the blindfold?)
THE PROBLEM WITH MEGA CAPS
Why is this so? Why do more stocks outperform than underperform? The reason seems to be that mega cap stocks have been an awful place to invest over the last 20 years, and they represent a significant overweight in the cap weighted construction of the S&P 500 index. Thus, mega cap stocks have dragged down the returns of the index and made it easier for the other stocks to outperform.
Source: FactSet; Lyrical analytics
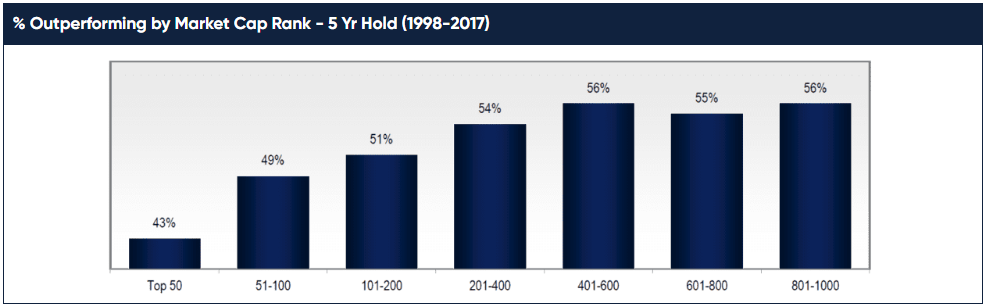
While 54% of all stocks have outperformed on a five-year hold basis, only 43% of the 50 largest market cap stocks do so. Put another way, within the top 50 stocks, over the last 20 years there were 32% more underperformers than outperformers. On the other hand, for the bottom 800 of the top 1,000 stocks, there were 23% more outperformers than underperformers. This is not a “small” cap effect, but an “anti-mega-cap” effect, as the outperformance rate was consistent from the 201st stock to the 1,000th.
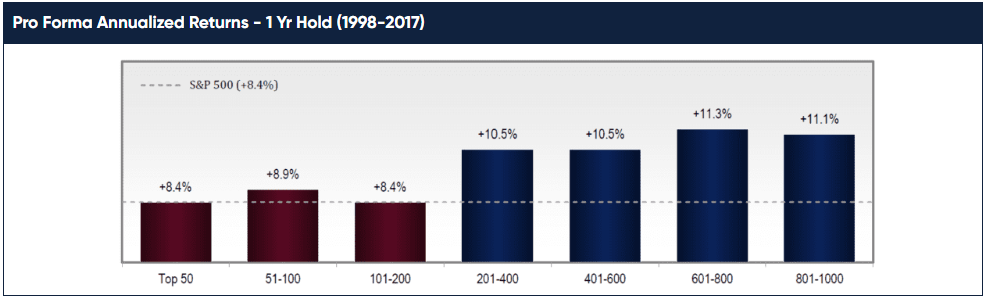
We can illustrate the weak performance of most mega caps by calculating pro forma returns by market cap ranking. On a one-year hold basis, the stocks in the top 200 closely match the S&P 500 return over the last 20 years, while the bottom 800 of the top 1,000 performed 200-300bp better per annum.
Source: FactSet; Lyrical analytics
On a five-year hold basis, the returns improve across the whole universe by roughly 100bp per annum. However, the performance advantage of the non-mega cap stocks remains the same, with the stocks in the bottom 800 of the top 1,000 performing 200-300bp better per annum than those in the top 200. Thus, over the last 20 years, combining a five-year hold with avoiding the largest 200 stocks would have produced returns 300-400bp per annum better than the S&P 500.

Source: FactSet; Lyrical analytics
CAPITALIZATION STRUCTURE OF THE MARKET
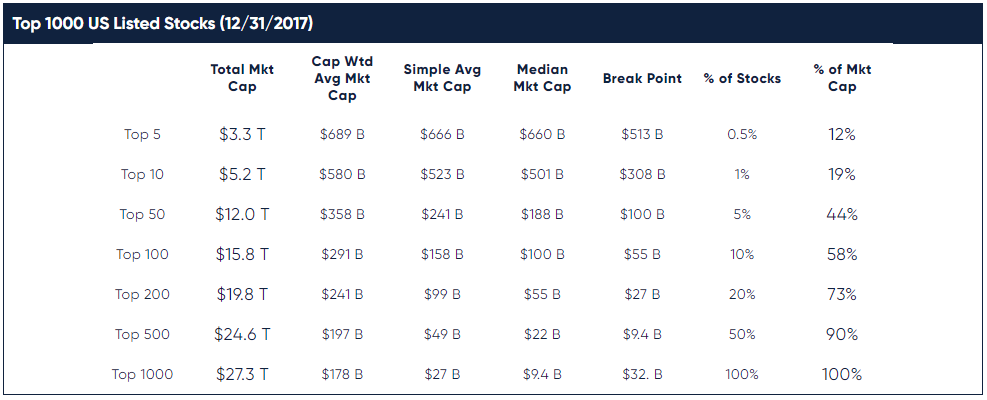
There is a lot of pressure on large cap portfolio managers to own as many mega cap stocks as possible, because they represent a huge weight in the large cap benchmarks. In the Malkiel’s Monkey paper, Arnott calculated that of the 1,000 stocks used for their universe, 40% of the capitalization was in the top 30 stocks. That is too much weight in too few stocks for a benchmark-conscious manager to ignore. The problem is that those top 30 stocks had an annual return of 8.6%, while the 970 stocks that make up the other 60% of the capitalization had an annual return of 10.5%, 190bp better.
We did our own breakdown of the capitalization structure of our 1,000-stock universe. Even though we know these facts, it still amazes us when we see on paper just how much capitalization is in the largest mega caps. For example, the top five stocks represent 0.5% of the stocks in this universe, but account for 12% of the capitalization. By contrast, the bottom 500 stocks represent 50% of the stocks, but account for only 10% of the capitalization. Keep in mind that the bottom 500 stocks are still large companies, with market caps between $3.2 and 9.4 billion. They are just dwarfed by the super-massive mega caps.
 Source: FactSet; Lyrical analytics
LYRICAL'S STOCKPICKING HAS BEEN IMPRESSIVE
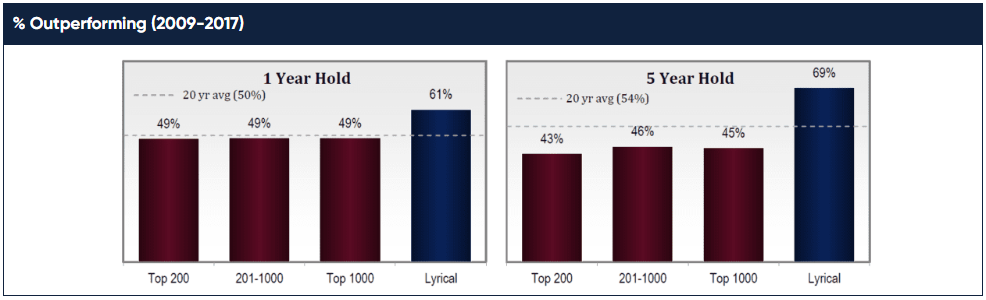
We have shown how well a manager could have performed with a randomly selected portfolio. This begs the question of how Lyrical’s stock selection has compared to random chance? Looking at the nine years since Lyrical’s inception, 61% of Lyrical’s stocks have outperformed the S&P 500 on a one-year hold basis. This is significantly higher than the universe of the top 1,000 stocks, where only 50% outperformed.
Source: FactSet; Lyrical analytics
On a five-year hold basis, our results were more impressive. Although 54% of the stocks in the top 1,000 have outperformed on this basis over the last 20 years, the nine-year period since Lyrical’s inception has been a difficult time for stock picking, with only 45% outperforming. Despite that, Lyrical has seen 69% of its stocks outperform over this period, a ratio of more than two outperformers for each underperformer. This is strong evidence supporting the merits of our approach to bottom-up stock selection.
TAKEAWAYS FROM THIS ANALYSIS
If it is so easy to outperform in large caps, why do so many active managers fail? Our belief is that human nature and institutional pressures have driven active managers to make suboptimal decisions. Human nature explains why holding periods are too short. Patience is difficult, and it takes discipline to stay with stocks that aren’t working in the short run. The analogy that comes to mind is a driver stuck in traffic, shifting from their lane that is stopped into the lane that is moving, only to see their new lane now stop, and their old lane begin to move. If they had only stayed in their old lane, they would get to their destination quicker, and with a lot less risk.
Institutional pressures, we believe, explain why managers emphasize mega caps in their portfolio, where their odds of picking outperformers have been less than 50% and much lower than everywhere else in large caps. These stocks have massive weights in the benchmarks. We have witnessed these pressures ourselves, as some investors have not embraced our product because our average market cap has been $20-30bn, instead of $100bn. That said, outperformance is rare among the mega caps, and Lyrical prefers performance over conformity.
We believe the moral of this story is not to give up on active management in large caps. It has not been difficult to generate better than market returns in this space over the last 20 years. Avoid the managers with short holding periods and high exposure to mega caps, and you could shift the odds of success in your favor.
CONCLUSION
At first glance, Lyrical had a decent year, significantly outperforming the Russell 1000 Value, but falling short of the S&P 500. However, it is important to consider the environment when evaluating performance over any short period of time like a quarter or year. For example, in 2009 the Russell 1000 Value returned 19.7% and the S&P 500 returned 26.5%. If Lyrical had returned, say, 30% and outperformed both indices, we should nonetheless have been disappointed given how great that year was for deeply undervalued stocks.
On the other hand, in 2017 we believe it was quite an achievement for a deep value strategy like ours to produce returns so close to the S&P 500, especially considering how much of the S&P 500’s return came from a handful of the largest stocks. The five largest stocks in the S&P are AAPL, GOOGL, MSFT, AMZN and FB, and in 2017 they had an average return of 46%, more than double the 22% return of the S&P. Additionally, 2017 was a difficult environment for stock picking. As the chart earlier in the letter showed, only 42% of the stocks in our 1,000-stock universe outperformed the S&P 500 in 2017, the lowest percentage in the nine years since our 2009 inception.
Over longer periods of time, such as five or ten years, the environment should become less relevant, and performance figures stand more on their own. We should perform better in an environment more favorable to value, but we are capable of outperforming even when that does not happen. In our nine years investing on behalf of our clients, the Russell 1000 Value has lagged the S&P 500 by 44.3%, and in only three of the nine years has the Russell Value outperformed the S&P. Despite that backdrop, our investing approach has produced a record that has outperformed both the Russell 1000 Value and S&P 500 in every rolling five-year period since our inception and has cumulatively outperformed the S&P by 185%, and the Russell Value by 225%.
That is all in the past, but we believe the portfolio today is well positioned to continue this record of success. As the first chart in this letter shows, the portfolio is currently at a historically wide valuation spread, which in the past has led to thousands of basis points of outperformance. Our optimism is further enhanced by the quality of the businesses we own and the superior earnings performance they have demonstrated. As always, we don’t know when our stocks will significantly outperform, but we are as confident as we could be that someday, perhaps soon, they will.
THIS IS NOT AN OFFERING OR THE SOLICITATION OF AN OFFER TO INVEST IN THE STRATEGY PRESENTED. ANY SUCH OFFERING CAN ONLY BE MADE FOLLOWING A ONE-ON-ONE PRESENTATION, AND ONLY TO QUALIFIED INVESTORS IN THOSE JURISDICTIONS WHERE PERMITTED BY LAW.
THERE IS NO GUARANTEE THAT THE INVESTMENT OBJECTIVE OF THE STRATEGY WILL BE ACHIEVED. RISKS OF AN INVESTMENT IN THIS STRATEGY INCLUDE, BUT ARE NOT LIMITED TO, THE RISKS OF INVESTING IN EQUITY SECURITIES GENERALLY, AND IN A VALUE INVESTING APPROACH, MORE SPECIFICALLY. MOREOVER, PAST PERFORMANCE SHOULD NOT BE CONSTRUED AS AN INDICATOR OF FUTURE PERFORMANCE.
THE S&P 500 INDEX IS A MARKET CAPITALIZATION WEIGHTED INDEX COMPRISED OF 500 WIDELY-HELD COMMON STOCKS.
THE RUSSELL 1000 VALUE INDEX MEASURES THE PERFORMANCE OF THE LARGE-CAP VALUE SEGMENT OF THE U.S. EQUITY UNIVERSE. IT INCLUDES THOSE RUSSELL 1000 COMPANIES WITH LOWER PRICE-TO-BOOK RATIOS AND LOWER EXPECTED GROWTH VALUES. THE RUSSELL 1000 VALUE INDEX IS CONSTRUCTED TO PROVIDE A COMPREHENSIVE AND UNBIASED BAROMETER FOR THE LARGE-CAP VALUE SEGMENT. THE INDEX IS COMPLETELY RECONSTITUTED ANNUALLY TO ENSURE NEW AND GROWING EQUITIES ARE INCLUDED AND THAT THE REPRESENTED COMPANIES CONTINUE TO REFLECT VALUE CHARACTERISTICS.
ADDITIONAL INFORMATION REGARDING LAM –U.S. VALUE EQUITY-CS:
PERFORMANCE FIGURES PRIOR TO AUGUST 2013 REFLECT THE MODEL, HYPOTHETICAL RESULTS FOR A HYPOTHETICAL PORTFOLIO PURSUING THE MARKET CAPITALIZATION WEIGHTED INVESTMENT GUIDELINES (THE “GUIDELINES”) DESCRIBED BELOW, AND DO NOT REPRESENT RETURNS OF ACTUAL INVESTMENTS MADE. THERE ARE A VARIETY OF LIMITATIONS INHERENT IN MODEL RESULTS. TRANSACTION EXPENSES HAVE BEEN INCLUDED AT FIVE CENTS PER SHARE, TO REFLECT COMMISSIONS AND EXPECTED MARKET IMPACT. DIVIDENDS HAVE BEEN INCLUDED IN THE RETURNS. LAM’S CLIENTS HAD RESULTS THAT WERE MATERIALLY DIFFERENT FROM THOSE PORTRAYED IN THE MODEL.
MARKET CAPITALIZATION WEIGHTED INVESTMENT GUIDELINES
LAM’S ORIGINAL, U.S. VALUE EQUITY – EQ IS AN APPROXIMATELY 34 STOCK PORTFOLIO THAT IS EQUAL WEIGHTED AT COST TO TARGET 99% INVESTED WITH 1% CASH, HENCE APPROXIMATELY 3% PER POSITION. WE HAVE PICKED A BENCHMARK CAPITALIZATION LEVEL (THE “CAPITALIZATION BENCHMARK”) EQUAL TO $11.2BN AS OF DECEMBER 31, 2013 AND EQUAL TO $11.2BN MULTIPLIED BY THE QUOTIENT DERIVED BY DIVIDING THE LEVEL OF THE S&P 500 INDEX® AT ALL OTHER TIMES BY 1,848.36 (THE CLOSING PRICE OF THAT INDEX ON DECEMBER 31, 2013).
TO REFLECT A PORTFOLIO THAT HAS GREATER LIQUIDITY, WE CREATED A MODEL PORTFOLIO WITH MODIFIED PORTFOLIO POSITION WEIGHTS.
- STOCKS WITH A MARKET CAPITALIZATION GREATER THAN THE CAPITALIZATION BENCHMARK HAVE BEEN MADE EQUAL WEIGHTED FULL POSITIONS.
- STOCKS WITH A MARKET CAPITALIZATION LESS THAN THE CAPITALIZATION BENCHMARK HAVE HAD THEIR POSITION WEIGHTS SCALED IN PROPORTION TO THEIR MARKET CAP.
FOR EXAMPLE, A STOCK WITH A $5.6BN MARKET CAPITALIZATION AS OF DECEMBER 31, 2013 WOULD HAVE BEEN GIVEN AN INITIAL PORTFOLIO WEIGHT OF 0.5X A FULL POSITION. A STOCK WITH A $3.4BN MARKET CAPITALIZATION AS OF DECEMBER 31, 2013 WOULD HAVE BEEN GIVEN AN INITIAL PORTFOLIO WEIGHT OF 0.3X A FULL POSITION.
WITH LESS CAPITAL ALLOCATED TO THE LESS LIQUID STOCKS, WE HAVE GROSSED UP THE SIZE OF A FULL POSITION FROM THE CURRENT 2.9% IN THE EQUAL WEIGHTED ORIGINAL PORTFOLIO TO APPROXIMATELY 3.8% IN THE HYPOTHETICAL MARKET CAPITALIZATION WEIGHTED PORTFOLIO, TO ACHIEVE A MODEL PORTFOLIO WITH 99% INVESTED IN STOCKS AND 1% CASH.
PERFORMANCE ESTIMATION METHODOLOGY
TO ESTIMATE THE HISTORICAL PERFORMANCE OF THE U.S. VALUE EQUITY–CS, MARKET CAPITALIZATION WEIGHTED PORTFOLIO, WE APPLIED THE METHODOLOGY DESCRIBED ABOVE TO THE STOCKS IN OUR ORIGINAL U.S. VALUE EQUITY-EQ PORTFOLIO OF DECEMBER 31, 2008.
WE MODELED THAT ALL PURCHASES OF NEW HOLDINGS AND EXITS FROM EXISTING HOLDINGS THAT TOOK PLACE DURING A MONTH IN OUR ACTUAL PORTFOLIOS TOOK PLACE AS OF THE END OF THAT MONTH IN THE BACKTEST MODEL.
IN MONTHS WHERE CASH WAS NEEDED BECAUSE THE SIZE OF THE PURCHASED STOCK EXCEEDED THE PROCEEDS FROM THE STOCK SOLD, WE MODELED THAT WE TRIMMED THE LARGEST POSITION (AT MARKET) IN THE PORTFOLIO TO GENERATE ENOUGH CASH TO COVER THE DIFFERENCE.
IN MONTHS WHERE THE CASH POSITION ROSE TO LEVELS ABOVE 1% WE DID NOT REINVEST THE EXTRA CASH.
THESE MODEL RESULTS ARE UNAUDITED AND SUBJECT TO REVISION AND SHOW ALL PERIODS BEGINNING WITH THE FIRST FULL MONTH IN WHICH THE ADVISOR MANAGED ITS FIRST FEE-PAYING ACCOUNT. HYPOTHETICAL NET RETURNS INCLUDE A 1.25% BASE FEE.