 *Partial period shown beginning August 1, 2013. †Net returns methodology is detailed at end of letter.
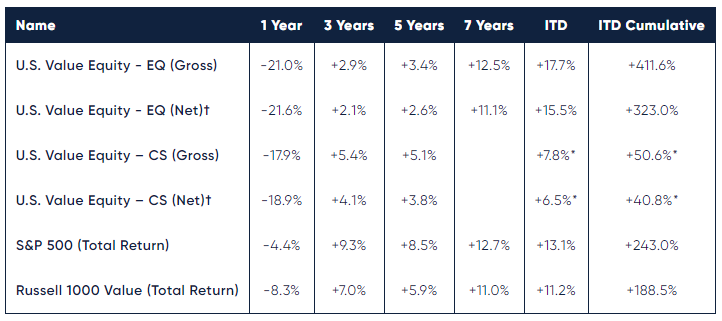
Lyrical started its business in 2008 and we have just celebrated our ten-year anniversary. Over this first decade we produced returns that have exceeded both the S&P 500 and Russell 1000 Value and rank in the top 1% of our peer group. Yet this is a bittersweet achievement, as we note that 2018 was by far our worst year.
When we started in 2008, it was a nightmarish year for investors. Even value investors, for all the merits of their approach, did little to protect capital, as value stocks fell with the general markets. Everyone felt lousy then, and no explanations proved soothing.
Now ten years later, after 2018, we again feel lousy. For all our talk of “margin of safety” and “upside,” our portfolios fared worse than the overall market in a highly volatile year. All investment styles have periods when they are out of favor, and 2018 was such a time for us.
We thank our investors for their past and present confidence in us. We appreciate your patience and understanding throughout this difficult year. As a consolation, we strongly believe the long-term rewards will more than compensate for this short-term pain. Like 2009, we enter 2019 with a very attractive portfolio and we believe we can produce in the next decade results comparable to the outstanding results we have delivered over the past one.
LOOKING BACK
In 2018, the U.S. Value Equity-EQ and U.S. Value Equity-CS composites produced gross returns of -21.0% (-21.6% net) and -17.9% (-18.9% net), respectively. Comparatively, the S&P 500 and Russell 1000 Value produced total returns of -4.4 % and -8.3%, respectively.
In analyzing our portfolio’s performance attribution, we find it helpful to examine both the investment success rate and any skew in the distribution of returns. Since inception, 73% of our investments have posted gains, and 60% have outperformed the S&P 500. In 2018, only 26% of our investments posted gains, and 24% outperformed the S&P 500. This year we had the lowest percentage of stocks outperforming the S&P 500 in our ten-year history. We attribute this low investment success rate to the environment for low P/E stocks, as we will explain below.
Skew was also a negative factor on an unweighted basis in 2018, as our outperformers outperformed the S&P 500 by 16% while our underperformers underperformed by 25%. This too we believe can be explained by the environment.
Portfolio turnover was 16.2% over the last twelve months, and since inception it stands at 14.5% annualized. During the year, we sold five stocks and purchased five replacements. Three sales were due to companies being acquired, and two sales were due to the stocks approaching our estimate of fair value.
WHAT WENT WRONG IN 2018?
As we do in every year, good performance or bad, in 2018 we continuously monitored the fundamentals of the companies in our portfolio, considered if any are at cyclical peaks or overearning, and examined current threats of disruption due to new technology or business models. Through this work, we maintained comfort that the businesses we own are well positioned for the future.
Additionally, we conducted many analyses to try to understand why 2018 performance was worse than our other years. We had several stocks whose consensus earnings expectations were significantly lowered, and we saw their stock prices decline. They could have been the problem, although we always have several of these stocks, even in our best performance years. We also had many stocks whose consensus earnings expectations were significantly raised that did not outperform as we thought they should. Perhaps these stocks were the problem.
To provide historical context to better understand our performance difficulties, we analyzed our ten-year history. We segmented each year’s portfolio into buckets based on how expected earnings changed over the course of that year. In the first bucket were the disappointing stocks whose consensus earnings expectations were significantly (more than 10%) lowered. In the second bucket were the overachieving stocks whose consensus earnings expectations were significantly (more than 10%) raised. The last bucket was everything else, the stocks whose consensus earnings expectations were not significantly (less than 10%) changed.
THE "DISAPPOINTMENTS"
The first chart below shows the percentage of our portfolio with significant negative revisions in each year of our history. As you see in the left chart below, 2018 was a pretty normal year in terms of percentage of stocks with significantly lowered consensus earnings expectations, as we always have a portion of our portfolio that is doing worse than expected. On the right chart below, you can see how those stocks performed. Normally they perform worse than the market, which is to be expected. And normally, not counting 2009, they do about 20 percentage points worse than the market. 2018 was abnormal compared to our history as our problem stocks were punished about twice as much as normal, performing more than 40 points worse than the S&P 500.
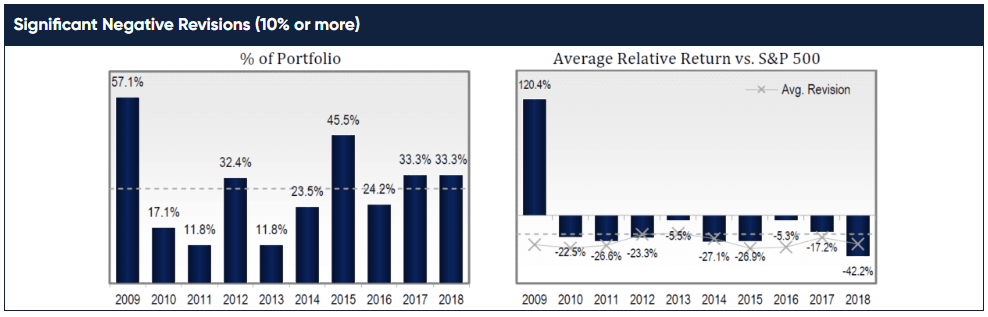
Source: FactSet; Lyrical analytics
We can also see from the line with the X’s what the average amount of the negative revision has been. One would expect that the stock reaction would be proportional to the magnitude of the revision, and that is generally what we see over our history. If anything, the stock reactions have been less severe than the magnitude of the revisions, perhaps because these stocks were already discounting the possibility of an earnings miss. Again, 2018 was abnormal in that the stock reactions were significantly worse than the magnitude of the revisions.
We estimate our returns would have been about 6 percentage points higher if we had more normal reactions to our earnings misses. This assumes that this 33.3% of our portfolio underperformed by 20% instead of 40%. While this impact is significant, we do not see it as the biggest driver of our underperformance in 2018.
THE "OVERACHIEVERS"
As we see it, the biggest driver of our underperformance was the absence of positive reactions for our many companies with significant positive revisions. As you see in the left chart below, 2018 was an outstanding year for the percentage of our companies with raised expectations. Almost 40% of our portfolio saw significant positive revisions since the beginning of the year. That is far above our normal level and handily our best year for this metric.
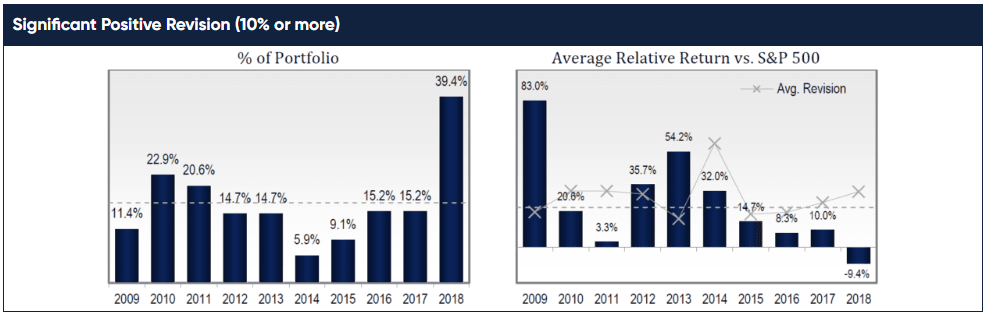
Source: FactSet; Lyrical analytics
What is abnormal, though, is that while these companies have done exceptionally well, their stock prices did not outperform the market. In fact, you can see on the right chart above that for the first time in our history, this portion of our holdings underperformed the S&P 500, and by a wide margin of more than 9 percentage points. Earnings for these companies were up, they grew even faster than expected, and yet their stock prices fell more than the market.
This abnormal outcome cannot be explained by a deficiency in the magnitude of the revisions. Not only was 2018 our best year for the percentage of stocks with positive earnings revisions, it was also one of our better years for the magnitude of those revisions. The average increase in earnings expectations for these stocks was 31%, meaning that consensus expectations increased by nearly a third throughout the course of the year.
As we see it most of our underperformance this year can be attributed to this group of overachievers underperforming instead of significantly outperforming. We estimate our returns would have been about 12 percentage points higher if we had more normal reactions to our positive earnings revisions. This assumes that this 39.4% of our portfolio outperformed by 20% instead of underperforming by 9%. We believe this group of overachievers provides the strongest evidence that our 2018 returns were not due to fundamental reasons and they give us the greatest confidence in our future outperformance.
THE "AS EXPECTEDS"
Lastly, about 27% of the stocks in our portfolio had no significant (< 10%) change in consensus earnings expectations over the year. As our positions typically start with low P/E ratios, just delivering on expected earnings tends to be good enough for our investments to succeed. We can see on the right chart below that historically, when our stocks meet earnings expectations, they often outperform or at worst slightly underperform. Once again, 2018 was abnormal, as this group of stocks underperformed by about 14%.
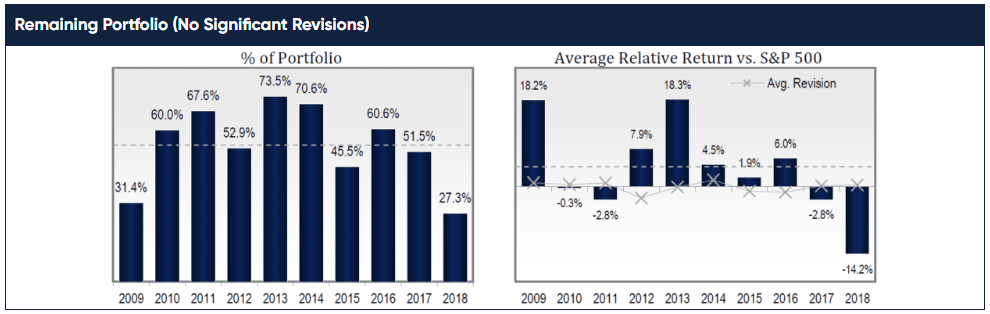
Source: FactSet; Lyrical analytics
We estimate our returns would have been about 4 percentage points higher if this group of stocks just performed in line with the S&P 500 instead of underperforming. This assumes that this 27.3% of our portfolio was even with the market instead of underperforming by 14%. While we see this as the group with the least impact on our 2018 returns, we believe they provide additional evidence that our performance was not due to fundamental reasons and they give us further confidence in future outperformance.
WERE THESE ISSUES JUST WITH LYRICAL STOCKS?
In summary, our stocks that had significant negative revisions performed much worse than normal. Our stocks that had significant positive revisions performed much worse than normal. And, our stocks that had no significant revisions performed much worse than normal. Whatever the fundamentals, all three groups had abnormal performance. Was this a problem specific to Lyrical?
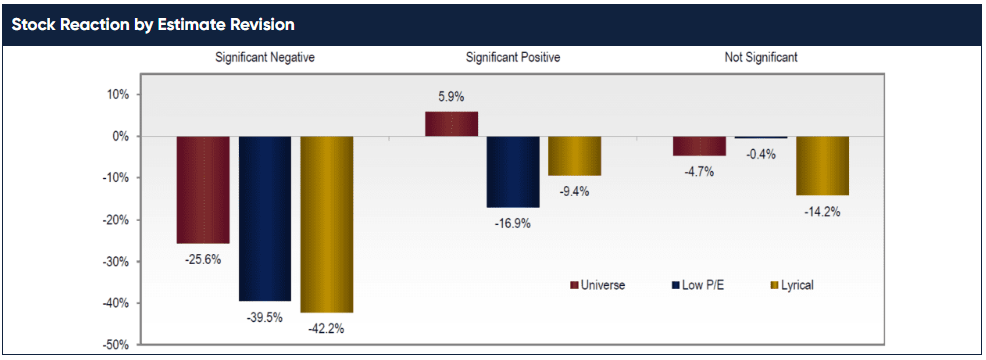
We believe the chart below shows that the negative reactions to our stocks was not unique to us but part of a phenomenon that impacted low P/E stocks broadly. In this chart, for each of the three buckets we analyzed above (“disappointments”, “overachievers” and “as expecteds”) we show the average relative stock reaction for three different populations of stocks. In red is our entire 1,000 stock universe, in blue are the 200 stocks from that universe with the lowest P/Es, and in yellow are the stocks from our portfolio.
Source: FactSet; Lyrical analytics
Starting with the three bars on the left, we examine the average relative performance for stocks with significant negative earnings revisions, the “disappointments”. For our 1,000 stock universe, the average relative reaction was about negative 25%, while it was about negative 40% for the lowest P/E stocks and our stocks. Thus, the extreme negative reaction we observed in our portfolio to negative earnings revisions was not evident in the overall market but was characteristic for stocks with low P/Es.
Looking at the middle three bars, we see the average relative performance for stocks with significant positive earnings revisions. For our 1,000 stock universe, the average relative reaction was positive 6%, while it was negative 17% for the lowest P/E stocks and negative 9% for our stocks. Again, the abnormal negative reaction we observed in our portfolio was not evident in the overall market but was characteristic for stocks with low P/Es.
Lastly, the three bars on the right show the average relative performance for stocks with no significant earnings revisions. For our 1,000 stock universe, the average relative reaction was negative 5%, while it was flat for the lowest P/E stocks and negative 14% for our stocks. We present this data for completeness, but we had only nine stocks in this category and our average was skewed by a couple outliers, specifically LNC and WHR.
Overall, we believe this comparison shows that the stock market had a severe negative bias against low P/E stocks in 2018, regardless of fundamentals and contrary to history. We believe it also supports our view that our disappointing 2018 returns were not a result of poor execution of our process, as our stocks performed similarly to other low P/E stocks in the market. To be clear, we expect our stocks over time to perform better than, not similarly to, other low P/E stocks (and the rest of the market), as they have done over the past decade. However, when low P/E stocks like ours are this much out of favor, it can be and has been too much of a headwind for our stock selection process to overcome in the short-run.
LOW P/E STOCKS WERE OUT OF FAVOR
By our analysis, 2018 was the worst year for the relative performance of low P/E stocks since the Internet Bubble burst roughly 20 years ago. As our investment approach tends to hunt for the best opportunities among the lowest P/E stocks, we too suffered the worst year of relative performance in our firm’s ten-year history.
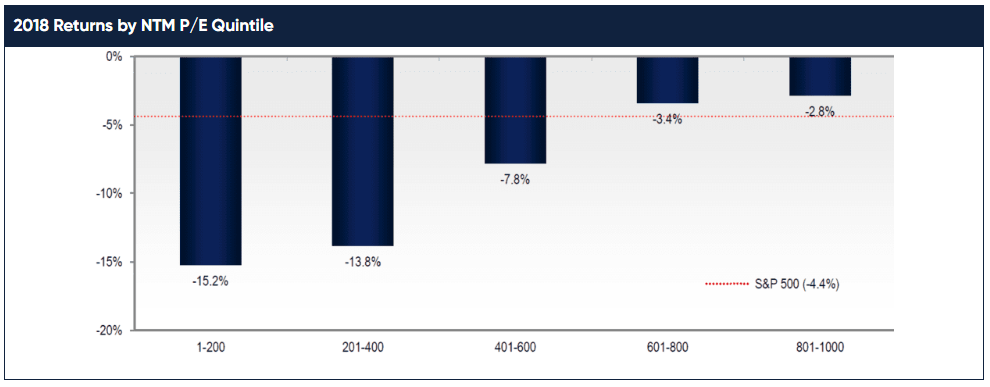
The chart below shows the performance by P/E groupings of stocks in our universe, the top 1,000 US stocks ranked by market cap. We sorted our universe according to P/E ratios at the start of the year and grouped it into quintile buckets of 200 stocks from lowest P/E to highest. We can see from the chart how as stocks got cheaper their 2018 performance was consistently worse. The cheapest quintile by P/E (stocks ranked 1-200) was down 15.2% for the year, 10.8 percentage points worse than the S&P 500 which was down only 4.4%. Clearly, low P/E stocks were significantly out of favor in 2018.
Source: FactSet; Lyrical analytics
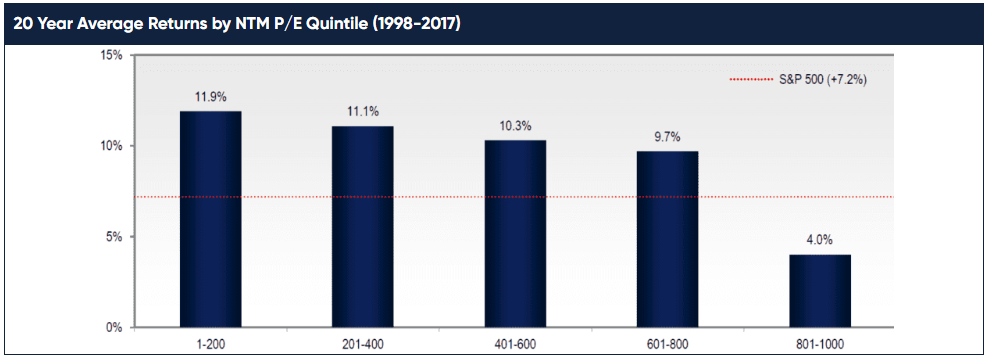
The experience of 2018 was completely contrary to the experience of the 20 years preceding it (1998-2017). We repeated the analysis for every year going back to 1998, which is as far back as we could get data from FactSet. We created a universe of the top 1,000 stocks at of the start of each year, sorted it by P/E ratios and grouped it into quintile buckets. We then calculated the 20-year annualized return for each bucket, which is presented in the chart below. In stark contrast to 2018, the historical norm has been that as stocks get cheaper their performance gets consistently better. The cheapest quintile by P/E has an annualized return of 11.9%, 4.7 percentage points better than the S&P 500 which returned 7.2%.
Source: FactSet; Lyrical analytics
A HISTORY OF LOW P/E STOCK PERFORMANCE
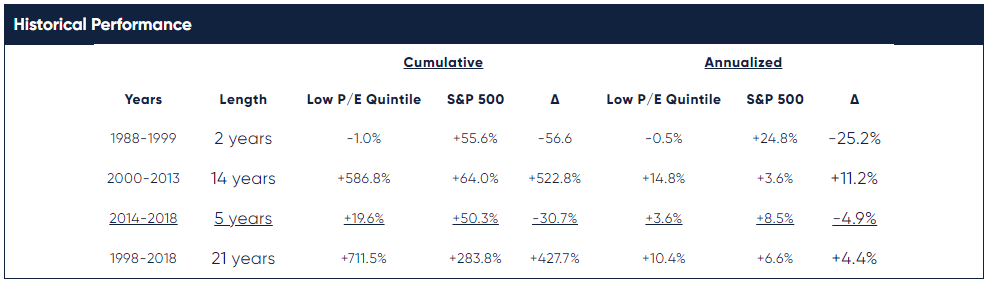
It was highly unusual in 2018 for the lowest P/E stocks to do the worst, and even more unusual for the underperformance to be so significant. The worst years for low P/E stocks over the past ~20 years were during the Internet Bubble years of 1998 and 1999. In 1998 the quintile of the lowest P/E stocks underperformed the S&P 500 by 26.6 percentage points, and then in 1999 underperformed by another 23.9 percentage points. As shown in the table below, cumulatively over 1998 and 1999, low P/E stocks were -1.0% compared to +55.6% for the S&P 500, resulting in 56.6 percentage points of underperformance.
When the Internet Bubble burst, low P/E stocks went on a glorious run for the next 14 years, outperforming the S&P 500 in every year except two, 2008 and 2011. Even in those years the underperformance was not severe, with 1.8 percentage points of underperformance in 2011 and 4.7 points in 2008. Cumulatively, low P/E stocks were +586.8% compared to +64.0% for the S&P 500, resulting in 522.8 percentage points of outperformance, or 11.2 points annualized.
Source: FactSet; Lyrical analytics
Low P/E stocks began to underperform in 2014 and have underperformed in four of the last five years. In three of these five years, relative performance was mild, with -3.5, +2.6, and -3.0 percentage points in 2014, 2016 and 2017, respectively. On the other hand, underperformance was severe in 2015 with 7.4 percentage points of underperformance and worse in 2018 with 10.8 points. All in, over these last five years low P/E cumulatively returned +19.6% compared to +50.3% for the S&P 500, resulting in 30.7 percentage points of underperformance, or 4.9 points annualized.
These past five years are unusual in that they have been the only five-year period in our 21-year data set where low P/E stocks failed to outperform the S&P 500. In fact, even if you had the poor timing of investing in low P/E stocks at the start of 1998 before the Internet Bubble inflated, over the next five years you still managed to outperform the S&P 500 by more than 6 percentage points per annum, and 36 points cumulatively. This shows how low P/E stocks have been able to overcome some awful timing in the past. We will see what 2019 delivers, but as bad as the Internet Bubble years were for low P/E stocks, after the bubble burst it took less than two years for them to recover the underperformance and pull ahead of the S&P 500.
What we see today is very encouraging based on the history we know. We are perhaps at the end of a value downcycle, and at worst in the middle. Either way this should be a fantastic entry point. It is possible performance continues to struggle for a while, but based on history, investing in the middle or end of a value downcycle has produced outstanding results over a five-year holding period.
WHY LOW P/E MATTERS
We have spent much of this letter covering low P/E stocks. As we look at our returns over the last decade, we see a clear pattern that our good years and bad years coincided with how well low P/E stocks fared. In fact, when we calculate the correlation of our annual returns versus the returns of the lowest P/E quintile it is 99.4%. By comparison, the correlation of our annual returns versus the S&P 500 is 90.6%. We see this as a benefit, a feature we have desired by design, as the lowest P/E stocks have the best long-term record of returns of any group we know.
Not all of our returns are driven by the performance of low P/E stocks. We have honed an investment process, in which we try to select the best of the best and avoid the worst of the worst. We do not always get it right, but we have added value, and thus our returns over this past decade have materially outperformed the simple return of owning the lowest P/E stocks. This is no easy feat, as we estimate the returns of the lowest P/E stocks have outperformed 96% of the value funds in the eVestment database over the last ten years.
LOOKING FORWARD
The portfolio at the end of 2018 is about as attractively valued as it has ever been, fueling our optimism for future returns.
Source: FactSet; Lyrical analytics
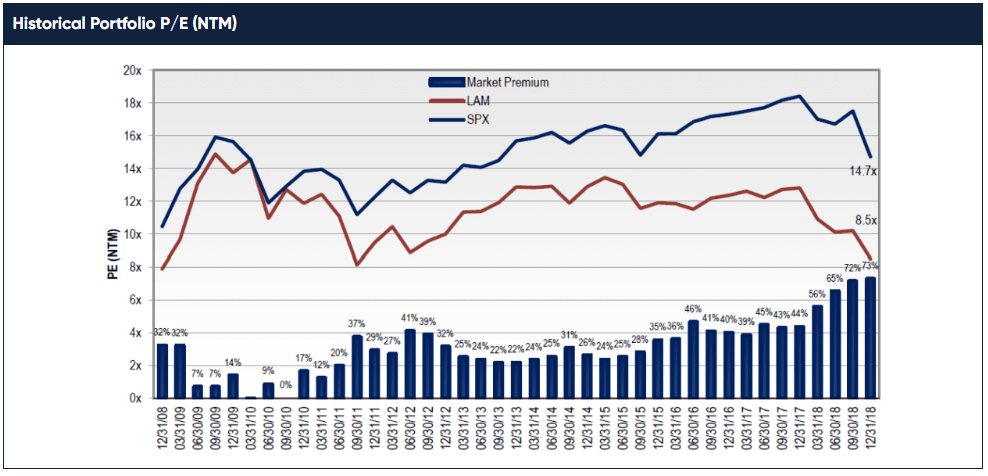
Over the year, our stocks declined on average, although their earnings grew nicely (~10%). As a result of lower prices and higher earnings, and also our replacing higher P/E stocks with lower P/E ones, the average P/E ratio of the portfolio on forward consensus earnings estimates compressed significantly from 12.8x at the start of the year to just 8.5x at the end. The S&P 500 had a valuation of 14.7x on this same basis, resulting in a historically wide premium of 73% relative to our P/E. To put this in perspective, over our firm history the S&P 500 has had an average P/E premium to our portfolio of ~25%. This is the widest valuation spread we have observed since our inception and we believe the spread is a good proxy for our outperformance potential. (Yes, we believe we can outperform by 73 percentage points over the next three-to-five years.)
CONCLUSION
On Main Street, when the price of an item goes down, people become more apt to buy. That is not how it works on Wall Street, where people like to buy when prices have gone up, and they like to sell when prices have gone down. It is human nature to want to buy stocks that are going up and sell stocks that are going down. This phenomenon can drive markets to extreme volatility. At the stock level, these emotional reactions can also go to excess, making some stocks too expensive and others too cheap. As value investors, we seek to take advantage of these excesses.
Value investing has a long history of success and has worked in just about every decade going as far back as academics can collect the data. Value investing has even been successful over this past decade. Although the Russell 1000 Value index has underperformed the S&P 500 over the last ten years, the lowest P/E stocks have actually outperformed by about 200bp per annum. Not too shabby.
While the data supports that value investing has worked over history, it is also true that it has had dismal results over the last twelve months. This kind of dismal performance is uncommon, but not unprecedented. In fact, it seems to happen for a year or two every ten-to-twenty years, most significantly in 1998 and 1999 during the Internet Bubble, and most recently in 2015 and 2018. So far, every period of dismal value stock performance has been followed by long periods of fantastic value stock performance, with the very best periods being the ones that followed the very worst. We do not see any reason to believe that this time will be different.
2018 was Lyrical’s tenth year investing for our clients. Over that ten-year period, we have outperformed the S&P 500 and the Russell 1000 Value indices, and our performance record ranks in the top 1% of our peer group. It is disappointing that our tenth year, 2018, ranks as our worst. While we believe we all should be focused on the long term, we also recognize the pain and difficulty that a year like 2018 can inflict. Unfortunately, we do not know any way to avoid the historically rare years like 2018 without significantly reducing long-term results. We appreciate the patience and understanding our client base has demonstrated throughout this year, and we strongly believe the long-term rewards will more than compensate for this short-term pain. We enter 2019 with arguably our most attractive portfolio in our history, which we believe can produce comparable results in the next decade as we have delivered over this past one.
THIS IS NOT AN OFFERING OR THE SOLICITATION OF AN OFFER TO INVEST IN THE STRATEGY PRESENTED. ANY SUCH OFFERING CAN ONLY BE MADE FOLLOWING A ONE-ON-ONE PRESENTATION, AND ONLY TO QUALIFIED INVESTORS IN THOSE JURISDICTIONS WHERE PERMITTED BY LAW.
THERE IS NO GUARANTEE THAT THE INVESTMENT OBJECTIVE OF THE STRATEGY WILL BE ACHIEVED. RISKS OF AN INVESTMENT IN THIS STRATEGY INCLUDE, BUT ARE NOT LIMITED TO, THE RISKS OF INVESTING IN EQUITY SECURITIES GENERALLY, AND IN A VALUE INVESTING APPROACH, MORE SPECIFICALLY. MOREOVER, PAST PERFORMANCE SHOULD NOT BE CONSTRUED AS AN INDICATOR OF FUTURE PERFORMANCE.
THE S&P 500 INDEX IS A MARKET CAPITALIZATION WEIGHTED INDEX COMPRISED OF 500 WIDELY-HELD COMMON STOCKS.
THE RUSSELL 1000 VALUE INDEX MEASURES THE PERFORMANCE OF THE LARGE-CAP VALUE SEGMENT OF THE U.S. EQUITY UNIVERSE. IT INCLUDES THOSE RUSSELL 1000 COMPANIES WITH LOWER PRICE-TO-BOOK RATIOS AND LOWER EXPECTED GROWTH VALUES. THE RUSSELL 1000 VALUE INDEX IS CONSTRUCTED TO PROVIDE A COMPREHENSIVE AND UNBIASED BAROMETER FOR THE LARGE-CAP VALUE SEGMENT. THE INDEX IS COMPLETELY RECONSTITUTED ANNUALLY TO ENSURE NEW AND GROWING EQUITIES ARE INCLUDED AND THAT THE REPRESENTED COMPANIES CONTINUE TO REFLECT VALUE CHARACTERISTICS.
ADDITIONAL INFORMATION REGARDING LAM –U.S. VALUE EQUITY-CS:
PERFORMANCE FIGURES PRIOR TO AUGUST 2013 REFLECT THE MODEL, HYPOTHETICAL RESULTS FOR A HYPOTHETICAL PORTFOLIO PURSUING THE MARKET CAPITALIZATION WEIGHTED INVESTMENT GUIDELINES (THE “GUIDELINES”) DESCRIBED BELOW, AND DO NOT REPRESENT RETURNS OF ACTUAL INVESTMENTS MADE. THERE ARE A VARIETY OF LIMITATIONS INHERENT IN MODEL RESULTS. TRANSACTION EXPENSES HAVE BEEN INCLUDED AT FIVE CENTS PER SHARE, TO REFLECT COMMISSIONS AND EXPECTED MARKET IMPACT. DIVIDENDS HAVE BEEN INCLUDED IN THE RETURNS. LAM’S CLIENTS HAD RESULTS THAT WERE MATERIALLY DIFFERENT FROM THOSE PORTRAYED IN THE MODEL.
MARKET CAPITALIZATION WEIGHTED INVESTMENT GUIDELINES
LAM’S ORIGINAL, U.S. VALUE EQUITY – EQ IS AN APPROXIMATELY 34 STOCK PORTFOLIO THAT IS EQUAL WEIGHTED AT COST TO TARGET 99% INVESTED WITH 1% CASH, HENCE APPROXIMATELY 3% PER POSITION. WE HAVE PICKED A BENCHMARK CAPITALIZATION LEVEL (THE “CAPITALIZATION BENCHMARK”) EQUAL TO $11.2BN AS OF DECEMBER 31, 2013 AND EQUAL TO $11.2BN MULTIPLIED BY THE QUOTIENT DERIVED BY DIVIDING THE LEVEL OF THE S&P 500 INDEX® AT ALL OTHER TIMES BY 1,848.36 (THE CLOSING PRICE OF THAT INDEX ON DECEMBER 31, 2013).
TO REFLECT A PORTFOLIO THAT HAS GREATER LIQUIDITY, WE CREATED A MODEL PORTFOLIO WITH MODIFIED PORTFOLIO POSITION WEIGHTS.
- STOCKS WITH A MARKET CAPITALIZATION GREATER THAN THE CAPITALIZATION BENCHMARK HAVE BEEN MADE EQUAL WEIGHTED FULL POSITIONS.
- STOCKS WITH A MARKET CAPITALIZATION LESS THAN THE CAPITALIZATION BENCHMARK HAVE HAD THEIR POSITION WEIGHTS SCALED IN PROPORTION TO THEIR MARKET CAP.
FOR EXAMPLE, A STOCK WITH A $5.6BN MARKET CAPITALIZATION AS OF DECEMBER 31, 2013 WOULD HAVE BEEN GIVEN AN INITIAL PORTFOLIO WEIGHT OF 0.5X A FULL POSITION. A STOCK WITH A $3.4BN MARKET CAPITALIZATION AS OF DECEMBER 31, 2013 WOULD HAVE BEEN GIVEN AN INITIAL PORTFOLIO WEIGHT OF 0.3X A FULL POSITION.
WITH LESS CAPITAL ALLOCATED TO THE LESS LIQUID STOCKS, WE HAVE GROSSED UP THE SIZE OF A FULL POSITION FROM THE CURRENT 2.9% IN THE EQUAL WEIGHTED ORIGINAL PORTFOLIO TO APPROXIMATELY 3.8% IN THE HYPOTHETICAL MARKET CAPITALIZATION WEIGHTED PORTFOLIO, TO ACHIEVE A MODEL PORTFOLIO WITH 99% INVESTED IN STOCKS AND 1% CASH.
PERFORMANCE ESTIMATION METHODOLOGY
TO ESTIMATE THE HISTORICAL PERFORMANCE OF THE U.S. VALUE EQUITY–CS, MARKET CAPITALIZATION WEIGHTED PORTFOLIO, WE APPLIED THE METHODOLOGY DESCRIBED ABOVE TO THE STOCKS IN OUR ORIGINAL U.S. VALUE EQUITY-EQ PORTFOLIO OF DECEMBER 31, 2008.
WE MODELED THAT ALL PURCHASES OF NEW HOLDINGS AND EXITS FROM EXISTING HOLDINGS THAT TOOK PLACE DURING A MONTH IN OUR ACTUAL PORTFOLIOS TOOK PLACE AS OF THE END OF THAT MONTH IN THE BACKTEST MODEL.
IN MONTHS WHERE CASH WAS NEEDED BECAUSE THE SIZE OF THE PURCHASED STOCK EXCEEDED THE PROCEEDS FROM THE STOCK SOLD, WE MODELED THAT WE TRIMMED THE LARGEST POSITION (AT MARKET) IN THE PORTFOLIO TO GENERATE ENOUGH CASH TO COVER THE DIFFERENCE.
IN MONTHS WHERE THE CASH POSITION ROSE TO LEVELS ABOVE 1% WE DID NOT REINVEST THE EXTRA CASH.
THESE MODEL RESULTS ARE UNAUDITED AND SUBJECT TO REVISION AND SHOW ALL PERIODS BEGINNING WITH THE FIRST FULL MONTH IN WHICH THE ADVISOR MANAGED ITS FIRST FEE-PAYING ACCOUNT. HYPOTHETICAL NET RETURNS INCLUDE A 1.25% BASE FEE.