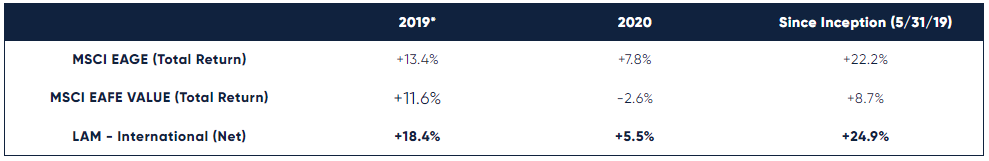
The pandemic tested our mettle, but our strategy and the companies in our portfolio navigated well through the volatile environment. We seek to own attractive businesses at attractive valuations, and this discipline helped us manage confidently through a challenging time. Despite a rocky start to 2020, our portfolio advanced 5.5% (net) for the year, outperforming our Foreign Large Value mutual fund category peers by 460bps.
After a bruising first quarter for international value stocks, it would have been hard to predict a solid gain in the portfolio this year. The cheapest stocks were hit especially hard at the onset of the pandemic, and the first quarter of 2020 marked the only quarter our strategy has underperformed the EAFE index since our inception in June of 2019. Most of the underperformance came during the first three weeks of March, before a sharp recovery. In the first quarter, we underperformed the EAFE by nine percentage points, but since then we outperformed by 15 percentage points, ending the year 230bps behind the EAFE, but 810bps ahead of our style benchmark, the EAFE Value.
While we managed through the year with a mid-single-digit return, value in general did not fare as well. We believe this unusual decline in cheap stocks has created an incredibly attractive opportunity set. Value stocks are now trading with historically wide spreads versus the market, which has typically led to sustained periods of outperformance. We have performed well in a difficult period, and we are looking forward to our results when the value winds are at our back.
*Partial year, inception date as of 5/21/19
THRIVE AND SURVIVE
While the COVID virus created an economic crisis like no other, we had good reason to believe that, on average, there was no more risk from the pandemic in our portfolio than in the overall market. At Lyrical, we have three requirements for every investment – Value, Quality, and Analyzability, or in other words, Inexpensive, Good, and Simple. One of the reasons we want to buy quality / good businesses is because they are resilient and can adapt. When you own a stock for 7-8 years on average, as Lyrical has done historically, it is likely you will own it through a recession. This is why a key part of our due diligence entails understanding how a business will respond to a weak economic environment. We want to own businesses that can not only thrive when times are good but also easily survive when times are tough.
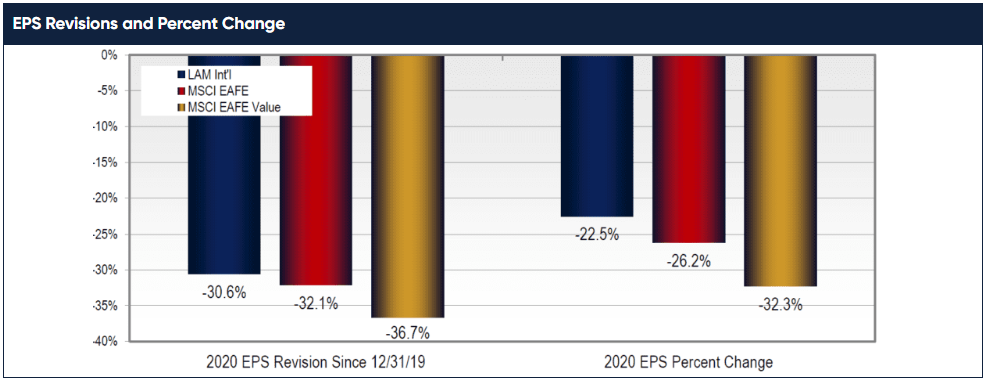
Our disciplined underwriting paid off in 2020, as our portfolio had better fundamentals, as indicated by earnings and earnings revisions, than the market and the value index. As shown below, 2020 EPS revisions and earnings for our portfolio declined less than both the EAFE and EAFE Value index. This did not surprise us. We invest in companies with durable competitive advantages, flexible cost structures, strong balance sheets, and healthy free cash flow. These qualities allow companies to persevere during economic setbacks. While we did not know what shape this particular crisis would take, we had already stress-tested our companies by analyzing their performance through extreme periods like the Global Financial Crisis, when our companies’ earnings also held up better than the market.
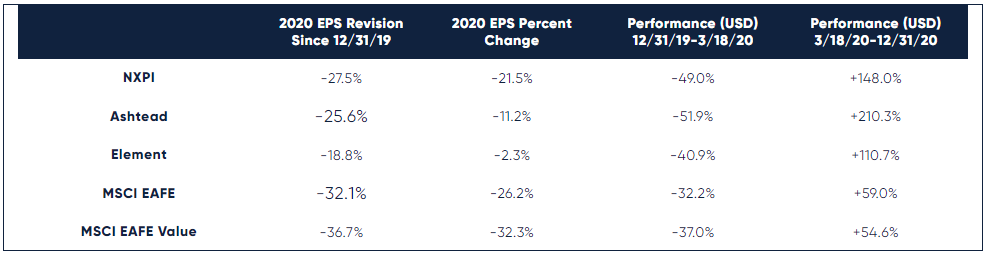
Despite the superior resiliency of the businesses we own, many of our stocks were punished worse than the market during the panic sell-off. As of March 18, 2020, 71% of our stocks were underperforming the MSCI EAFE Index, down an average of 40.5% year-to-date, compared to down 32% for the EAFE.
Given the outperformance of our portfolio’s fundamentals, we think the early sell-off in our stocks is yet another example of the market behaving emotionally. Falling stock prices can create a vicious cycle, as they scare more investors into selling, which then causes prices to fall more. Stock prices go from being an indication of a company’s worth to reflecting pure emotion. Of course, our companies were hurt by the pandemic, but, evidently, they were hurt less than the market. Furthermore, our businesses’ long-term earnings power has been mostly unaffected and, in some cases, has improved because of COVID-19.
SOME CLEAR EXAMPLES
Let’s look beyond the aggregate portfolio data to examine a few stock examples that help show how the market overreacted (although, explaining why isn’t as easy). Below, we show the 2020 earnings estimate revisions and earnings change for three of our companies—NXPI, Ashtead, and Element—compared to the market. We also show that these stocks underperformed significantly through March 18th, only to rebound dramatically in the ensuing months.
In 2019, deep value underperformance continued but with much more volatility. Deep value stocks had some very good months, but they were offset by worse months soon after. January was a great month but was offset by March. Then April was good, but May was terrible. June was good again, but August was the worst month of this entire period.
As bad as August looks on this chart, it was actually worse a few days before month end. But then, starting on August 28th, deep value stocks began to outperform significantly. The positive performance from the last days of August continued into September, which turned into a very strong month for deep value stocks. Since September, deep value stocks have continued to outperform, without any significant offsetting months.
We have reason to believe that August ended the 20-month downcycle for deep value. We saw a pattern emerge in 2019 that has been seen at the end of the last four value cycles going back 40 years. First, prior upcycles have started with a bang not a whimper, meaning a month of significant outperformance, as we saw in September. Second, prior cycles were darkest before the dawn, with the worst months of underperformance at the end of the downcycle, which we saw in August. Last, the timing was right for this to be the turn in the cycle. The average duration of prior downcycles is 20 months, and as of August this cycle had lasted 20 months.
In fairness, this is educated guesswork. We were hopeful that January 2019 was the start of the upcycle. It fit the same pattern that we saw in September except that the timing was short at 12 months, not 20. As it turned out, January was not the turn we hoped for. We cannot be sure September is the turn either, but we become more and more confident with each passing month.
- NXPI is a semiconductor company with the #1 position in radar technology for auto collision avoidance and autonomous driving. For 2020, EPS is expected to decline 22%, due in large part to global auto production shutdowns that occurred during the spring. Longer-term, little has changed, and the current 2022 consensus EPS estimate is near where it was prior to the pandemic and 67% higher than 2020. Through March 18th, NXPI was down 49%, which we believe was driven by the company’s exposure to the then-struggling auto sector. At that point, it was hard to know when auto supply chains would start up again. Regardless of how long the shutdown endured, it was easy to see that NXPI would grow secularly over the long-haul as more vehicles employ NXPI chips for collision avoidance, battery management, and more. We capitalized on the opportunity and purchased the stock on March 16.
- Ashtead, based in the U.K., is the #2 tool rental equipment company in North America and has been a position in our portfolio since inception. Early in the pandemic, there was a concern that demand would collapse, and the stock price dropped 53% in less than one month. We did not know exactly how far demand would fall, but we knew the business would benefit from countercyclical cashflows. Because of Ashtead’s scale as the #2 player, the company has negotiating leverage with suppliers. As a result, they can cut their new equipment orders with just 45-60 days notice. We saw the company cut capex by about 80% in the financial crisis, and we knew Ashtead could once again pull the same lever in an abrupt slowdown. This is exactly what happened. Even though EPS is expected to decline 11% in 2020, free cash flow is expected to increase 72%, to a record £1.1 billion. The stock initially sold off like other industrial cyclicals before the market realized Ashtead’s resiliency. From the bottom, the stock gained 210%, and it ended up 49% on the year. We were confident the company could survive a downturn, and now we once again should get the rewards from the company thriving in a rebound. Ashtead is a secular winner, benefitting from scale and technology advantages that allow it to consistently take share from the mom-and-pop businesses that still control most of the market.
- Element is a leading global commercial vehicle fleet management business. The company manages mission-critical cars, vans, and trucks for a diverse set of customers, including Amazon, whose businesses are heavily dependent on their fleets. While Element provides many services for its customers—purchasing, repair, and fuel to name a few—it does not bear any residual risk for the vehicles it leases to them. This means that even a sharp downturn is unlikely to impair the business. In the financial crisis, credit losses peaked at around 10bps. The company’s relationships are sticky and revenues are recurring. Suffice it to say, we were surprised to see the stock down 41% in the early part of the year, and we took advantage of the dislocation to make our investment on April 7. With fewer corporate vans on the road, service revenue fell 8% year-over-year in the second quarter, but by the third quarter service revenue was already rebounding and was +2% compared to the prior year. For all of 2020, EPS fell only 2%, a commendable result although far less than original expectations for 20% EPS growth. While the stock has more than doubled off the bottom, we are still in the middle innings of a shift to outsourced vehicle management that we think will drive double-digit earnings growth for years to come.
The examples above illustrate how owning resilient businesses, supported by detailed fundamental analysis, can make it easier to maintain our conviction even in a panic-driven market. A list of all of our recommendations is available upon request.
THE REPORTS OF VALUE'S DEMISE ARE GREATLY EXAGGERATED
While our portfolio has fared well relative to the MSCI EAFE, the MSCI EAFE Value Index has significantly underperformed. In fact, the EAFE Value Index has been underperforming for so long that we are frequently asked if value investing is broken. We can understand the question. Since 2017, the EAFE Value Index has underperformed the EAFE by 25 percentage points. Furthermore, the EAFE Value Index has underperformed the EAFE in 10 of the past 14 years.
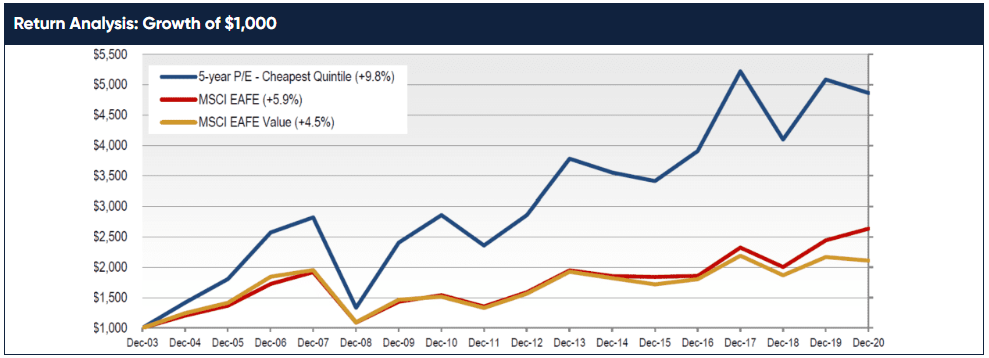
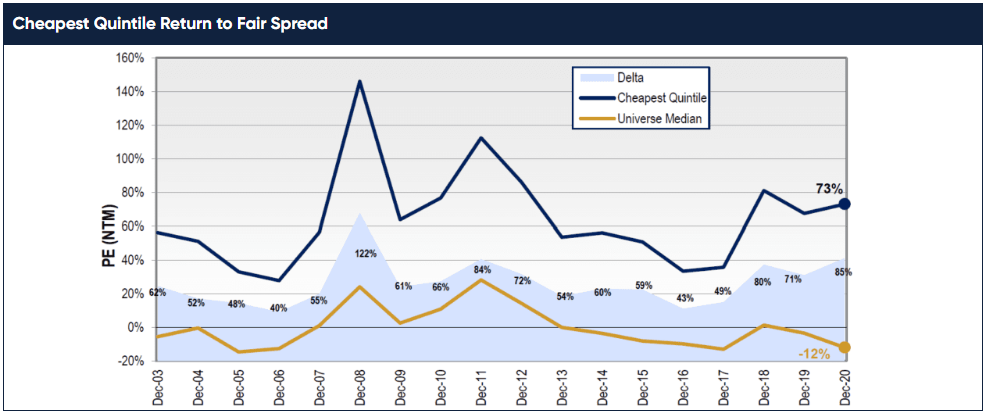
It is our view, though, that it is the value index that may be broken, but not value investing. Instead of looking at the performance of the MSCI EAFE Value Index, if you look at the performance of the cheapest stocks in the non-U.S. developed markets, you see a very different picture emerge. The cheapest stocks have outperformed the MSCI EAFE Value in 10 of the past 15 years. As you can see above, the cheapest quintile of our international universe has outperformed the MSCI EAFE and EAFE Value indices by 390bps and 530bps, respectively per annum, going back to 2004 which is as far back as we have reliable data.
YOU CAN'T GET VALUE FROM AN INDEX
Our cheapest quintile outperforms the EAFE Value because it reflects the cheapest companies based on long-term earnings power. A value investor wants to maximize future cashflows for the cheapest price possible, and our valuation quintiles therefore sort based on 5-year forward P/Es. MSCI has other ideas in mind when it constructs its value index, which oddly chooses to favor companies with low levels of growth. Here’s how it works. For each constituent in the EAFE Index, MSCI assigns a value score and a growth score. Stocks with high value scores and low growth scores go into the value index. Stocks with high growth scores and low value scores go into the growth index. But what about stocks that have a high value score and a high growth score? These are some of the best opportunities and where we spend most of our time sourcing ideas – cheap stocks with high growth. But, to MSCI, these stocks confuse the algorithm, so they are included in both the Value and Growth indices at partial weights, diluting their influence.
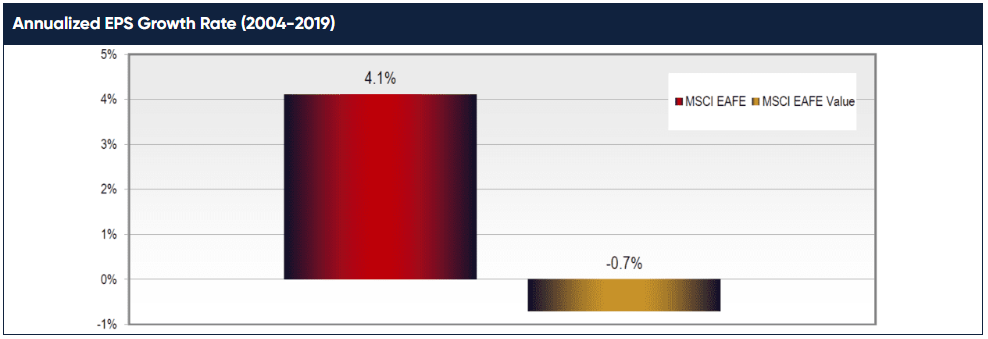
With MSCI solving for value and no growth, it is not surprising that the EAFE Value stocks have delivered the very poor earnings growth seen above; that is what they are looking for. From 2004-2019, earnings for the EAFE Value index declined by 0.7% per year, compared to growth of 4.1% for the EAFE. Compare that to the earnings performance of our value screen, and you will find the cheapest quintile we study compounded EPS at 3.3%.
EXTREME TIMES CREATE EXTREME OPPORTUNITIES
While value stocks have significantly outperformed over the long-haul, they go through downcycles like we saw in 2008, 2018, and in early 2020. These downturns have historically created some of the best opportunities to buy value. Below, we show the median return to fair value for the cheapest quintile, compared with our universe median return to fair value. The shaded blue area shows that the spread between the upside available in the cheapest stocks is about 85% higher than that of the broader international market. That valuation gap is wider than at any period over the past 17 years apart from during the global financial crisis.
NOT ALL VALUE FUNDS WILL BENEFIT
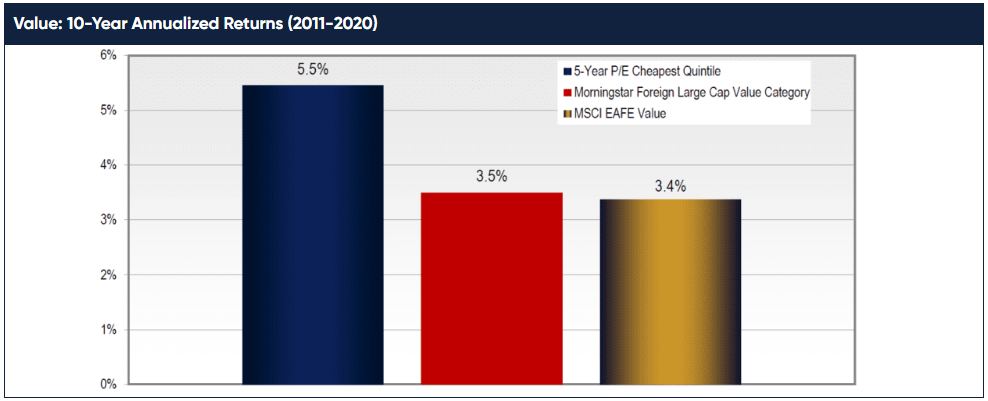
We believe that the prospects for value stocks are great, but we have our doubts that many value managers will capitalize on them. Our value peers have performed similarly to the EAFE Value over time, and we know that tracking this index is not a recipe for alpha. As shown below, the Morningstar Foreign Large-Cap Value Category has performed almost exactly in-line with the EAFE Value Index while it has materially underperformed our cheapest quintile.
At Lyrical, we do things differently. With a basic premise that a security’s intrinsic value is the present value of future cash flows, we are looking long-term. We value our businesses based on their five-year forward sustainable earnings power. Because we incorporate five years of growth into our earnings estimates, we identify a different group of companies as value stocks compared to MSCI: companies with growth and value.
Our cheapest quintile is a fertile place to begin our hunt for value investments, but our performance in 2020 helps show why the real work comes after that. Even though we believe we screen more effectively than the MSCI for value, we know the cheapest quintile is still full of a lot of junk. In 2020, we outperformed our cheapest quintile by 980bps, as the fundamentals of our companies held up better. Our U.S. value equity strategy has outperformed the cheapest quintile by 270bps annualized over 12 years. The cheapest quintile of our screen is a starting point; it allows us to sort our universe efficiently and effectively, so we are spending our time researching the most fruitful investment candidates. From that point, we conduct the deep fundamental analysis to assess business quality and investment controversies.
In some ways, our research process that whittles down our 300-name cheapest quintile to our ~30-stock portfolio is more about saying ‘no’ than ‘yes’. As a result of passing on most businesses in the cheapest part of the market, we do not own what many consider typical value stocks. Within the cheapest quintile, there are many stocks that deserve to be cheap: slow-moving, highly regulated banks, complicated conglomerates, sprawling oil and gas companies, and more. Our companies include: the #1 market share smart grid maker, the #1 and #2 global music labels, a leading European online gaming company, a print-on-demand marketplace for independent artists that is growing 25%+, an internet-of-things software provider, and more.
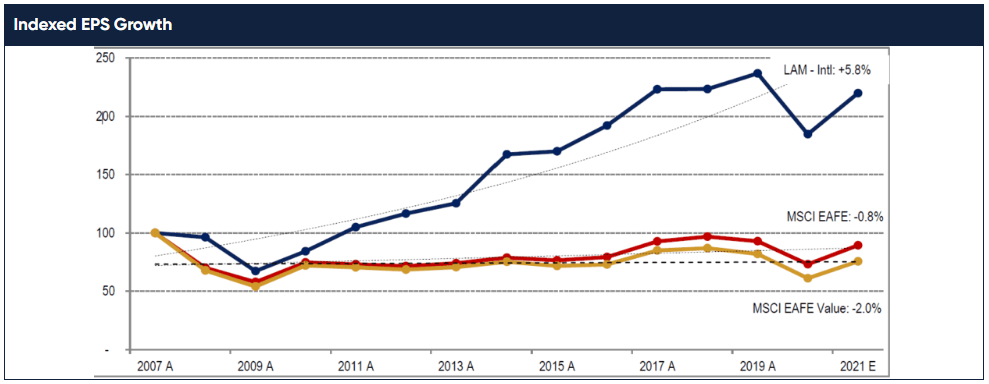
We own compounders with an average ROIC above 15% that have grown their earnings, through two downturns, at 6% since 2007, compared to the EAFE at -1%, as you can see above. Even though our portfolio has stronger earnings, it is also cheap, with an estimated upside to fair value of 75% for our portfolio, just above that of the cheapest quintile. We expect this uncommon combination of value and growth to drive outperformance for years to come.
CONCLUSION
Our core objective is to sift among the cheapest stocks to find great businesses, investing in the ‘gems’ amongst the ‘junk’. So far, we believe we have been able to do just that. Despite launching our fund amidst the weakest value environment since the financial crisis, we are proud to report we have outperformed the EAFE benchmark by 270bps (net, inception-to-date), even as the cheapest quintile has underperformed by 810bps.
2020 was a period that tested our process and team. By focusing on the long-term earnings power of our businesses, and not on daily stock moves, we were able to make good investment decisions in the face of great uncertainty. Now with value stocks and our portfolio at what we believe are highly attractive levels, we have great expectations for our future returns.
We have worked together for many years (at Lyrical and a prior firm). We work well together—even in trying times like 2020—because we remain unemotional and objective, while always being willing to question our investments and each other. We know that what matters over the long run is getting the earnings for our businesses right, and we are happy to be patient if the market disagrees with us in the short-term. We count ourselves lucky to have a firm and clients that allow us to invest with this long-term horizon that we believe will allow us to generate alpha for years to come.
We thank you for your confidence, and, as always, we welcome your inquiries.
John Mullins & Dan Kaskawits,
Co-Portfolio Managers
THIS IS NOT AN OFFERING OR THE SOLICITATION OF AN OFFER TO INVEST IN THE STRATEGY PRESENTED. ANY SUCH OFFERING CAN ONLY BE MADE FOLLOWING A ONE-ON-ONE PRESENTATION, AND ONLY TO QUALIFIED INVESTORS IN THOSE JURISDICTIONS WHERE PERMITTED BY LAW.
THERE IS NO GUARANTEE THAT THE INVESTMENT OBJECTIVE OF THE STRATEGY WILL BE ACHIEVED. RISKS OF AN INVESTMENT IN THIS STRATEGY INCLUDE, BUT ARE NOT LIMITED TO, THE RISKS OF INVESTING IN EQUITY SECURITIES GENERALLY, AND IN A VALUE INVESTING APPROACH, MORE SPECIFICALLY. MOREOVER, PAST PERFORMANCE IS NOT NECESSARILY INDICATIVE OF FUTURE RESULTS.
LAM - INTERNATIONAL RESULTS ARE UNAUDITED AND SUBJECT TO REVISION, ARE FOR A COMPOSITE OF ALL ACCOUNTS, AND SHOW ALL PERIODS BEGINNING WITH THE FIRST FULL MONTH IN WHICH THE ADVISOR MANAGED ITS FIRST FEE-PAYING ACCOUNT. NET RETURNS INCLUDE A 0.75% ANNUAL BASE FEE.
THE MSCI EAFE INDEX IS AN EQUITY INDEX WHICH CAPTURES LARGE AND MID CAP REPRESENTATION ACROSS 21 DEVELOPED MARKET COUNTRIES AROUND THE WORLD, EXCLUDING THE US AND CANADA. WITH 918 CONSTITUENTS, THE INDEX COVERS APPROXIMATELY 85% OF THE FREE FLOAT-ADJUSTED MARKET CAPITALIZATION IN EACH COUNTRY.
THE MSCI EAFE VALUE INDEX CAPTURES LARGE AND MID CAP SECURITIES EXHIBITING OVERALL VALUE STYLE CHARACTERISTICS ACROSS DEVELOPED MARKETS COUNTRIES AROUND THE WORLD, EXCLUDING THE US AND CANADA. THE VALUE INVESTMENT STYLE CHARACTERISTICS FOR INDEX CONSTRUCTION ARE DEFINED USING THREE VARIABLES: BOOK VALUE TO PRICE, 12-MONTH FORWARD EARNINGS TO PRICE AND DIVIDEND YIELD.
Notes:
All market data is courtesy of FactSet.
Returns by 5-Year Forward P/E Quintiles:
International Return to Fair Quintiles are sorted by Lyrical’s estimate of Return to Fair for each of the 1,500 largest non-U.S. developed market (“International”) stocks. Quintiles are determined annually, using end of year Return to Fair quintiles. Return to Fair is the difference between the current market price and Lyrical’s estimate of fair value. Fair value is the product of five-year forward projected earnings (determined by applying to the latest year of forward projected earnings the median analyst estimate of long-term growth rates, subject to a 17% maximum and a minimum of 10% less the dividend yield) multiplied by the country-specific earnings multiple, plus net cash, plus five times the positive (or minus five times the negative) difference between dividend yield and the median dividend yield of the investment universe. This does not reflect the experience of any investor.
Annualized EPS Growth Rate:
EPS growth is calculated for each International Return to Fair Quintile determined as of the beginning of each calendar year, equally weighting the 1,500 largest International stocks.
Indexed EPS:
This chart depicts the historical change of earnings per share of the companies comprising the LAM International portfolio as of December 31, 2020, using equal weights as of all dates, and the change in earnings per share of the MSCI EAFE Index and MSCI EAFE Value Index over the same period. Earnings per share is computed using consensus earnings data, which include certain adjustments from reported, GAAP earnings. Periods marked with an “E” include estimated earnings per share. LAM International portfolio holdings are included from the earliest date of their available data.