The coronavirus pandemic tested the mettle of many investors, but our disciplined investment process carried us through a challenging year with strong results. By focusing on the long-term earnings power of a business, and not day-to-day market moves, we were able to make good investment decisions in the face of great uncertainty. We started the year with the worst quarter in our firm’s history, and we finished with one of the best. Through all the ups and downs, our net return for the year was a gain of over 12%. To many, this would have been an unthinkable result back in March, but we have seen markets like this before and we were not surprised at our recovery given the strength of the fundamentals our businesses displayed.
This was a challenging year for all of us, and, as we reflect on the year, we could not be prouder of how Lyrical handled all its challenges. We have worked hard to create a firm culture that our employees want to be a part of, and we were honored when Pensions & Investments recognized Lyrical Asset Management as one of the best places to work in 2020.
We also could not be prouder of our clients. They say you get the clients you deserve, and, if that is the case, then we must have done something right. The vast majority of our clients persevered through some very difficult performance earlier this year. The painful period only spanned 3½ weeks, just 18 trading days, but when we were in the middle of it, it sure did not feel that quick. But the period ended, as all the bad periods have done in the past, and our loyal clients enjoyed a rapid recovery, a triple-digit gain off the bottom and even a double-digit gain on the year.
A TALE OF THREE MARKETS
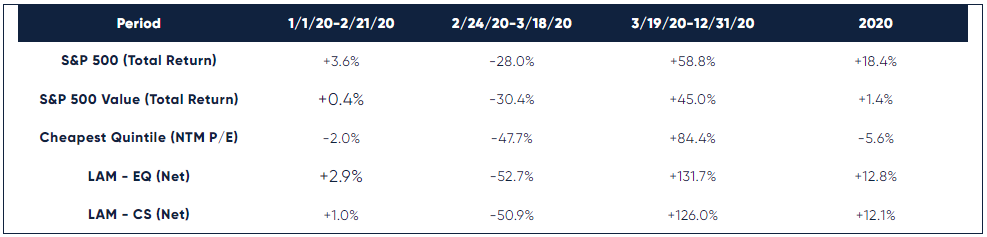
Last year we wrote that the story of 2019 was a tale of two markets. For 2020, we can describe the year as a tale of three markets. Ironically, given the events to come, the year started out in dull fashion. There was a bit of a selloff in late January, when stories of a virus in China began to emerge, but there was a recovery in the first weeks of February. By Friday, February 21st, the S&P 500 was up 3.6% on the year. Our performance slightly lagged this but was ahead of the S&P 500 Value and the performance of the cheapest quintile of stocks in our universe.
Then, everything changed on Monday, February 24th. Starting that day, the market began one of the steepest selloffs in history. Over the next 3½ weeks (just 18 trading days) the S&P 500 fell 28%. Low P/E stocks were punished much more severely, falling 48%. Lyrical’s portfolios, which are also filled with many of the lowest P/E stocks, were also severely punished, falling a gut-wrenching 51 and 53%.
*Please refer to Notes for important details regarding data presented herein
We cannot explain why our stocks fell so much. Prior to adding each stock to the portfolio, we had carefully underwritten each business for how it should behave in an economic downturn. While the COVID pandemic created an economic crisis like no other, we had good reason to believe that, on average, there was no more risk from the pandemic in our portfolio than in the overall market. On that basis, our stocks should have been down the same as the market, or probably even less due to their lower valuations. This is not how the market reacted at the time, even though our assessment of our portfolio fundamentals proved to be correct, if not conservative.
After March 18th, the underperformance ended for low P/E stocks in general, and Lyrical stocks in specific. The S&P 500 bottomed a few days later, on March 23rd. Since our bottom, we have enjoyed one of the best performance runs of our careers. On average, our companies’ earnings were less impacted by the pandemic than the S&P 500’s. Based on the fundamentals, our stocks should not have sold off as much as they did, and the market slowly began to recognize this. Beginning on March 19th, our portfolio produced a triple digit return, far outpacing the S&P 500, the S&P 500 Value, and even the cheapest P/E stocks.
The recovery over the final 9½ months of the year was strong enough to raise our YTD returns from a low of down over 50% on March 18th to a final return of up over 12% at year end, outperforming our style benchmark, the S&P 500 Value, by over 1,000 bps.
We also outperformed the cheapest quintile by over 1,700 bps. We are especially proud of this result. There is a very high correlation, over 90%, between the cheapest quintile returns and Lyrical’s returns. It is unusual for us to differ so starkly from the cheapest quintile’s performance, as we were up more than double what the cheapest quintile was down. We do have a history of outperforming the cheapest quintile by 270 bps per annum over our 12-year history, but this degree of differentiation was unusually good. We think this shows that we have executed our stock selection process well and have done a good job of picking out the “gems” amongst the “junk”.
IT AINT OVER 'TILL IT'S OVER
One might think that our recovery from the March 18th bottom had to be Lyrical’s best performance period. Well, not quite. The last 9½ months have certainly been outstanding, but they still are not as outstanding as what Lyrical produced back in 2009. The circumstances are quite different today with a global pandemic compared to then with a global financial crisis, but the return pattern off the bottom is quite similar. Our EQ composite net return was over 130% off the bottom this year but was over 150% after the same amount of time off the bottom in 2009.
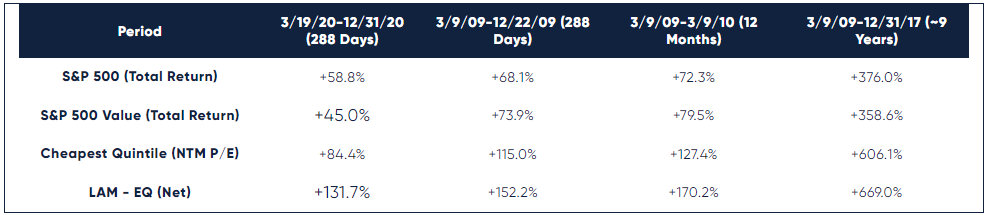
For those that are thinking that after such strong outperformance we must be near the end of the value recovery, let us look at what history has shown. We can see that our portfolio kept outperforming in the 2009 era and was up 170% in the twelve months after the bottom. While the rate of outperformance slowed after that, we continued to outperform over the next eight years. If you exited our portfolio at this point in 2009, which none of our clients did, you would have missed 517 additional percentage points of return, 293 percentage points more than the S&P 500 and 310 percentage points more than the S&P 500 Value.
WHAT WERE THEY THINKING?
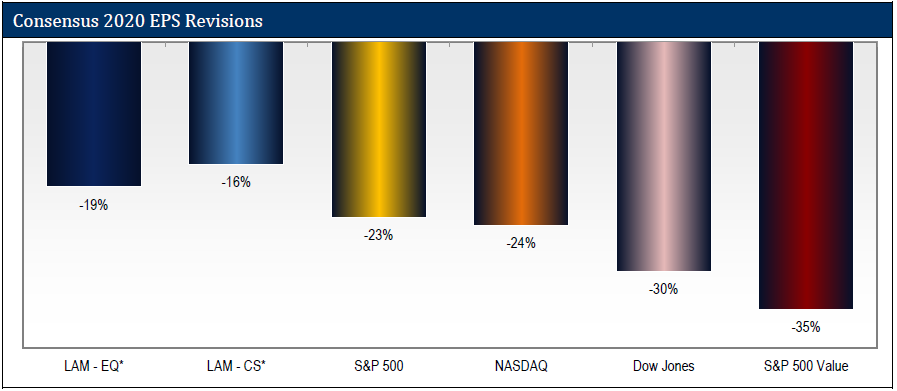
We believe the biggest driver of our outperformance since March 18th is the partial recognition by the market that the selloff of our stocks was unwarranted. The basis for this view is the 2020 consensus estimate revisions for our current portfolio compared to several major market indices.
There has been a narrative that value stocks went down more this year because they are more economically sensitive. That narrative rings true for the S&P 500 Value, whose 2020 EPS estimates fell 35% during the year, more than 1.5x the 23% negative revision of the S&P 500. However, this narrative was not true for our value portfolio.
The data in the chart below clearly show that our stocks have been less impacted by the events of 2020 than the S&P 500 or even the NASDAQ. Those two indices have seen their 2020 estimates cut by 23% and 24%, respectively. By contrast, the stocks in our portfolio experienced only a 16% and 19% estimate reduction for our EQ and CS constructions. That is a 20-30% lower impact for our portfolios than for those indices.
*Please refer to Notes for important details re data presented herein
In hindsight, it now appears that back in March the markets overreacted and sold off our stocks on fears that never materialized, and probably should have never been imagined if the market properly understood these businesses.
In February and March, the stock market was in a panic, and in a panic, prices can go from being a source of
information to a source of
influence. Rather than reflecting what the wisdom of the crowd thinks the company is worth, falling prices scare other investors into selling. This can cause the market to overreact and drive stock prices too low. To avoid this panic trap, we focus on fundamental research to inform our decision making, not price action.
It is easy to understand why the market would panic, as the COVID pandemic was unlike anything we have experienced in our lifetime. How can you focus on fundamental research when you cannot know what is going to happen to the world? Well, even though the events were unprecedented, it did not mean that we did not know anything. For example, we knew the sources of demand for the businesses we owned. We knew how much of their costs were fixed and variable. We knew what levers management could pull to adjust their businesses to current conditions. We knew how much debt they had on their balance sheet, how much was owed in the near term, and how much cash they had and could probably generate to pay it off. And we knew how each business behaved during a different period of economic difficulty – the Global Financial Crisis.
While we did not have perfect information, we had enough information to make good investment decisions, allocate our capital to the best risk/reward situations, and patiently stomach the volatility to earn great rewards.
OF COURSE THESE COMPANIES FARED WELL IN 2020
It should not come as a surprise that the companies in our portfolio were less sensitive to the economic impact of the COVID pandemic. The chart below shows the historical EPS growth of our two portfolio constructions compared to the S&P 500 and the S&P 500 Value. Looking back at the last economic crisis, we can see that the stocks in our portfolio were less economically sensitive back then, too. From peak earnings in 2007 to trough earnings in 2009, the average earnings decline for our portfolios was 19-21%. By comparison, the S&P 500 earnings fell 29%, which is 38-54% more than our portfolios’ earnings fell. The S&P 500 Value was even worse, as its earnings fell by 35%.
As indicated by the revision analysis, the economic sensitivity of this crisis was directionally in line with the last one. From 2019 to 2020, the average earnings decline for our stocks was only 10-12%. By comparison, the S&P 500 earnings fell 17.5%, which is 45-75% more than our portfolios’ earnings fell. The S&P 500 Value index was again even worse, as its earnings fell by 28%, 60% more than the S&P 500 EPS decline and well more than double Lyrical’s decline.
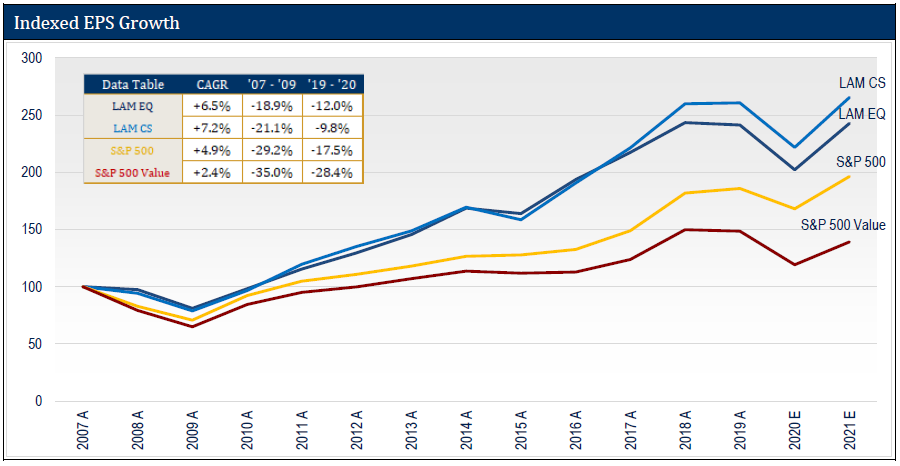
Not only have our stocks historically been less economically sensitive, but, more importantly, they have
grown their earnings faster. Over the last economic cycle and the recent crisis, the EPS of our companies have compounded at 6.5% and 7.2%, depending on the portfolio construction we use. The S&P 500 has only grown its earnings at 4.9%, and the S&P 500 Value at a meager 2.4%.
One would think that you would have to pay a premium for a portfolio with earnings characteristic superior in both long term growth and economic sensitivity. That would be a rational expectation. The reality is that you can now own our portfolio at a substantial discount to both these indices.
GREAT EXPECTATIONS
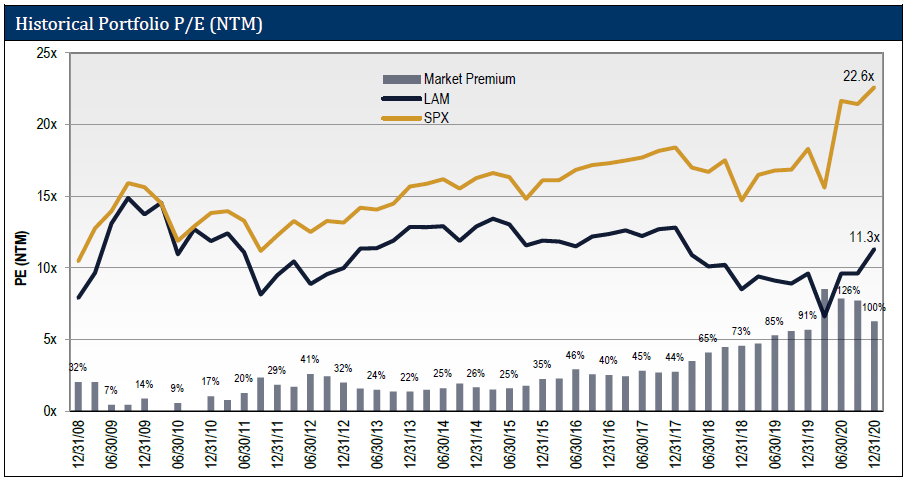
At the end of 2009, after a year of tremendous absolute and relative performance, our portfolio had a NTM P/E ratio of 13.7x. The S&P 500 had a slightly higher NTM P/E ratio of 15.6x, a 14% premium. At the end of 2020, even after our double-digit gain for the year, and triple-digit gain off the bottom, our portfolio has a NTM P/E ratio of just 11.3x. So, on this simple metric, our portfolio is 18% cheaper today than 2009. The same cannot be said for the S&P 500. The NTM P/E ratio for the S&P 500 was 22.6x at year-end 2020, 45%
higher than 2009.
With the combination of our multiple being lower, and the S&P 500 multiple being higher, the valuation spread has blown out to extraordinary proportions. Instead of the 14% spread we had at the end of 2009, we have a
100% valuation spread at the end of 2020.
As we showed above, after the tremendous absolute and relative performance of 2009, we continued to outperform over the next eight years until the end of 2017. Entering 2021, the valuation spread is 86 percentage points wider, and the absolute NTM P/E is 18% lower. Therefore, we would expect the next eight years to be potentially better on an absolute basis, and substantially better on a relative basis. Given these characteristics, would you want to bet otherwise?
BEWARE THE VALUE INDICES...
With its superior earnings characteristics and discount valuation, we are extremely bullish on the prospects for our value portfolio. However, we do not have the same conviction in our style benchmark, the S&P 500 Value index. Looking at the recent performance of that index off the March 18th bottom, or its longer-term performance over the decades, it is hard to be confident that this index will do well.
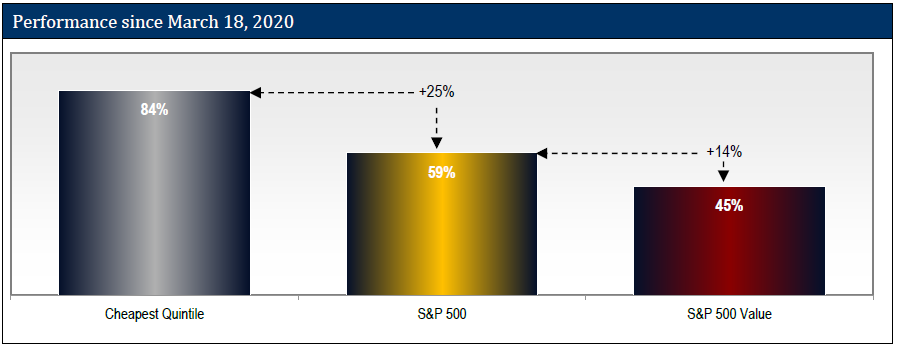
Let us start by looking at recent history and comparing the S&P 500 Value performance to our preferred proxy of value stock performance, the cheapest P/E quintile of our 1,000-stock universe. Since the March 18th bottom, the cheapest quintile has returned 84.4%, 25.6 percentage points
more than the S&P 500. The S&P 500 Value index has had the opposite experience, returning 45.0%, or 13.8 percentage points
less than the S&P 500.
It is not just 2020. If we go back to last decade, the cheapest P/E quintile of stocks had a great nine-year run of performance from 2009 to 2017. They produced an annualized return of 19.4%, 410 bps per annum better than the S&P 500. Did the S&P 500 Value outperform, too? No, sadly it did not. That index had an annualized return of 13.7%, 160 bps per annum worse than the S&P 500.
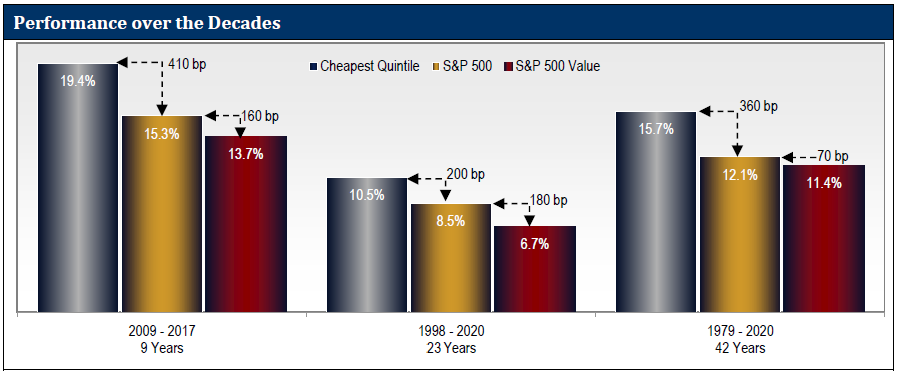
It is not just the last decade. We have 23 years of NTM P/E data going back to 1998. These 23 years include some tough times for value stocks, including: the tech bubble, the global financial crisis, and the recent FANG era and growth stock boom. Even with all those tough times, the cheapest P/E quintile had an annualized return of 10.5%, 200 bps better than the S&P 500. Again, over this long period, the S&P 500 Value returns were disappointing. That index had an annualized return of 6.7%, 180 bps worse than the S&P 500.
We can even go back to the inception of the S&P style indices in 1979. Since we do not have NTM P/E data that far back, we use LTM P/E as far back as we have it, and then use P/B for the earliest years. In each case we still measure the performance of the cheapest quintile by each measure. Can you guess the outcome? Over the full 42-year period, the cheapest P/E quintile had an annualized return of 15.7%, 360 bps better than the S&P 500, and the S&P 500 Value returns disappointed. That index had an annualized return of 11.4%, 70 bps worse than the S&P 500.
...AND BEWARE THE PASSIVE FUNDS THAT TRACK THEM
We, obviously, believe in value investing. We, perhaps surprisingly, also believe in passive investing. The data is too compelling that most active managers do not outperform passive indices. That said, we, emphatically,
do not believe in passive value investing
. It could be possible to create an effective passive approach to value investing, but that approach is not how the large-cap value indices are constructed. And since all the major passive value products track the large-cap value indices, we do not see a good passive value product in the marketplace.
TRACKING IS THE ERROR
When people proclaim that “value is dead” they often cite as evidence the underperformance of the large-cap value benchmarks like the S&P 500 Value. As the data above show, these value
indices do not track the performance of value
stocks. For more insight into what might be behind the problems with these indices, please see our 2019 Review Letter.
Our portfolio does not look like the S&P 500 Value. It more closely resembles the cheapest quintile, except our companies have much higher earnings growth, and our net returns have been higher by 270 bps per annum over our 12-year history. Since we do not look like the S&P 500 Value, we have had high “tracking error” relative to that index. While this is true, we take offense to the term “tracking error.” The word error implies that we have done something wrong by differing from the index. From our point of view, though, given the poor performance record of the S&P 500 Value over multiple long, time horizons, the real “
error” would be for us to “
track” the index.
We do not mean to single out the S&P 500 Value index for criticism. If you calculate the returns of the large-cap value indices from Russell or MSCI, you will find that they all perform about the same as the large-cap value index from S&P. This is not an issue unique to S&P, but a common problem for all the large-cap value indices from the major providers.
CONCLUSION
2020 was a year we will remember for a long time, even though most of it we would like to forget. The selloff tested the mettle of investors, but we held firm to our investment process. Our decisions were guided by our fundamental research, avoiding the influence of price action. Over the course of the year, as the financial impact of the pandemic became clearer, our assessment of our portfolio fundamentals proved to be correct, if not conservative, and our discipline was rewarded.
We now believe March 18th to be the end of the value downcycle that began in 2018. Since then, low P/E stocks in general and Lyrical stocks in specific have had an incredible recovery. We believe this was driven by the partial recognition by the market that the selloff in many value stocks was unwarranted. The triple-digit recovery in our stocks was strong enough that we finished the year with a double-digit gain, and more than 1,000 bps of outperformance over the S&P 500 Value index.
We have great expectations for our future returns. Our portfolio companies have shown themselves to be less economically sensitive than the S&P 500 and have also produced better historical growth. Despite these superior earnings characteristics, our portfolio has half the multiple of the S&P 500. We believe our better earnings and lower valuation will fuel many years of outperformance, as good or better than the many years of outperformance we experienced in the aftermath of the Global Financial Crisis.
As always, we are bullish on value stock investing. However, we cannot be confident in the large-cap value indices, like the S&P 500 Value. Value stock investing has a long track record of delivering market beating returns in decade after decade. Unfortunately, indices like the S&P 500 Value have an equally long record of underperforming despite the success of low multiple stocks.
Active management is not justified everywhere, but we believe that 2020 shows the importance of active management in value investing. We think the lowest multiple stocks outperform over time because of behavioral reasons. Human nature is to overreact and push some stock multiples too low. Blindly buying the lowest multiple stocks captures that overreaction and benefits when it unwinds. As active managers, we can do better than just blindly buying the lowest multiple stocks. While many low multiple stocks are “junk” deserving of their low multiple, some are “gems” that are truly mispriced. We seek to collect these “gems” in our portfolio, which has resulted in an uncommon combination of both value and growth. This approach has served us well, delivering outperformance over the S&P 500, S&P 500 Value and the cheapest quintile over our 12-year history, and we expect it to continue to serve us well in the years to come.
Andrew Wellington,
Founder
Chief Investment Officer
THIS IS NOT AN OFFERING OR THE SOLICITATION OF AN OFFER TO INVEST IN THE STRATEGY PRESENTED. ANY SUCH OFFERING CAN ONLY BE MADE FOLLOWING A ONE-ON-ONE PRESENTATION, AND ONLY TO QUALIFIED INVESTORS IN THOSE JURISDICTIONS WHERE PERMITTED BY LAW.
THERE IS NO GUARANTEE THAT THE INVESTMENT OBJECTIVE OF THE STRATEGY WILL BE ACHIEVED. RISKS OF AN INVESTMENT IN THIS STRATEGY INCLUDE, BUT ARE NOT LIMITED TO, THE RISKS OF INVESTING IN EQUITY SECURITIES GENERALLY, AND IN A VALUE INVESTING APPROACH, MORE SPECIFICALLY. MOREOVER, PAST PERFORMANCE SHOULD NOT BE CONSTRUED AS AN INDICATOR OF FUTURE PERFORMANCE.
THE S&P 500 INDEX IS A MARKET CAPITALIZATION WEIGHTED INDEX COMPRISED OF 500 WIDELY-HELD COMMON STOCKS.
THE RUSSELL 1000 VALUE INDEX MEASURES THE PERFORMANCE OF THE LARGE-CAP VALUE SEGMENT OF THE U.S. EQUITY UNIVERSE. IT INCLUDES THOSE RUSSELL 1000 COMPANIES WITH LOWER PRICE-TO-BOOK RATIOS AND LOWER EXPECTED GROWTH VALUES. THE RUSSELL 1000 VALUE INDEX IS CONSTRUCTED TO PROVIDE A COMPREHENSIVE AND UNBIASED BAROMETER FOR THE LARGE-CAP VALUE SEGMENT. THE INDEX IS COMPLETELY RECONSTITUTED ANNUALLY TO ENSURE NEW AND GROWING EQUITIES ARE INCLUDED AND THAT THE REPRESENTED COMPANIES CONTINUE TO REFLECT VALUE CHARACTERISTICS.
ADDITIONAL INFORMATION REGARDING LAM –U.S. VALUE EQUITY-CS:
PERFORMANCE FIGURES PRIOR TO AUGUST 2013 REFLECT THE MODEL, HYPOTHETICAL RESULTS FOR A HYPOTHETICAL PORTFOLIO PURSUING THE MARKET CAPITALIZATION WEIGHTED INVESTMENT GUIDELINES (THE “GUIDELINES”) DESCRIBED BELOW, AND DO NOT REPRESENT RETURNS OF ACTUAL INVESTMENTS MADE. THERE ARE A VARIETY OF LIMITATIONS INHERENT IN MODEL RESULTS. TRANSACTION EXPENSES HAVE BEEN INCLUDED AT FIVE CENTS PER SHARE, TO REFLECT COMMISSIONS AND EXPECTED MARKET IMPACT. DIVIDENDS HAVE BEEN INCLUDED IN THE RETURNS. LAM’S CLIENTS HAD RESULTS THAT WERE MATERIALLY DIFFERENT FROM THOSE PORTRAYED IN THE MODEL.
MARKET CAPITALIZATION WEIGHTED INVESTMENT GUIDELINES
LAM’S ORIGINAL, U.S. VALUE EQUITY – EQ IS AN APPROXIMATELY 34 STOCK PORTFOLIO THAT IS EQUAL WEIGHTED AT COST TO TARGET 99% INVESTED WITH 1% CASH, HENCE APPROXIMATELY 3% PER POSITION. WE HAVE PICKED A BENCHMARK CAPITALIZATION LEVEL (THE “CAPITALIZATION BENCHMARK”) EQUAL TO $11.2BN AS OF DECEMBER 31, 2013 AND EQUAL TO $11.2BN MULTIPLIED BY THE QUOTIENT DERIVED BY DIVIDING THE LEVEL OF THE S&P 500 INDEX® AT ALL OTHER TIMES BY 1,848.36 (THE CLOSING PRICE OF THAT INDEX ON DECEMBER 31, 2013).
TO REFLECT A PORTFOLIO THAT HAS GREATER LIQUIDITY, WE CREATED A MODEL PORTFOLIO WITH MODIFIED PORTFOLIO POSITION WEIGHTS.
- STOCKS WITH A MARKET CAPITALIZATION GREATER THAN THE CAPITALIZATION BENCHMARK HAVE BEEN MADE EQUAL WEIGHTED FULL POSITIONS.
- STOCKS WITH A MARKET CAPITALIZATION LESS THAN THE CAPITALIZATION BENCHMARK HAVE HAD THEIR POSITION WEIGHTS SCALED IN PROPORTION TO THEIR MARKET CAP.
FOR EXAMPLE, A STOCK WITH A $5.6BN MARKET CAPITALIZATION AS OF DECEMBER 31, 2013 WOULD HAVE BEEN GIVEN AN INITIAL PORTFOLIO WEIGHT OF 0.5X A FULL POSITION. A STOCK WITH A $3.4BN MARKET CAPITALIZATION AS OF DECEMBER 31, 2013 WOULD HAVE BEEN GIVEN AN INITIAL PORTFOLIO WEIGHT OF 0.3X A FULL POSITION.
WITH LESS CAPITAL ALLOCATED TO THE LESS LIQUID STOCKS, WE HAVE GROSSED UP THE SIZE OF A FULL POSITION FROM THE CURRENT 2.9% IN THE EQUAL WEIGHTED ORIGINAL PORTFOLIO TO APPROXIMATELY 3.8% IN THE HYPOTHETICAL MARKET CAPITALIZATION WEIGHTED PORTFOLIO, TO ACHIEVE A MODEL PORTFOLIO WITH 99% INVESTED IN STOCKS AND 1% CASH.
PERFORMANCE ESTIMATION METHODOLOGY
TO ESTIMATE THE HISTORICAL PERFORMANCE OF THE U.S. VALUE EQUITY–CS, MARKET CAPITALIZATION WEIGHTED PORTFOLIO, WE APPLIED THE METHODOLOGY DESCRIBED ABOVE TO THE STOCKS IN OUR ORIGINAL U.S. VALUE EQUITY-EQ PORTFOLIO OF DECEMBER 31, 2008.
WE MODELED THAT ALL PURCHASES OF NEW HOLDINGS AND EXITS FROM EXISTING HOLDINGS THAT TOOK PLACE DURING A MONTH IN OUR ACTUAL PORTFOLIOS TOOK PLACE AS OF THE END OF THAT MONTH IN THE BACKTEST MODEL.
IN MONTHS WHERE CASH WAS NEEDED BECAUSE THE SIZE OF THE PURCHASED STOCK EXCEEDED THE PROCEEDS FROM THE STOCK SOLD, WE MODELED THAT WE TRIMMED THE LARGEST POSITION (AT MARKET) IN THE PORTFOLIO TO GENERATE ENOUGH CASH TO COVER THE DIFFERENCE.
IN MONTHS WHERE THE CASH POSITION ROSE TO LEVELS ABOVE 1% WE DID NOT REINVEST THE EXTRA CASH.
THESE MODEL RESULTS ARE UNAUDITED AND SUBJECT TO REVISION AND SHOW ALL PERIODS BEGINNING WITH THE FIRST FULL MONTH IN WHICH THE ADVISOR MANAGED ITS FIRST FEE-PAYING ACCOUNT. HYPOTHETICAL NET RETURNS INCLUDE A 1.25% BASE FEE.