Upon examination, 2021 was a great year for Lyrical. Our absolute net return of ~30% was well above our 17% annualized net return since inception. On a relative basis, we outperformed the S&P 500 by a bit and beat the S&P 500 Value index by about 500 bps.
The rebound in value stocks that began around the market bottom during the COVID panic in March 2020 continued into 2021. Cheap stocks, those with low P/E ratios, were one of the best performing groups of the year. Lyrical benefited from this tailwind and our portfolio has roughly tripled since the rebound began.
As the economy reopens, COVID is still wreaking economic havoc, but now in the form of inflation. Demand has come back strong after being shut in by lockdowns, but supply chains and labor forces are still recovering. With demand outstripping supply, shortages and upward price pressures are prevalent. While inflation has been bad for the broad market in the past, it has nonetheless been good for value stocks, a pattern we hope to see continue with any current bout of inflation.
We head into 2022 well positioned. Our portfolio enters 2022 with a lower valuation than it started 2021 due to earnings growth and stock replacements. Moreover, the portfolio has had the best long-term growth profile in our firm’s history. This uncommon combination of deep value and quality growth is a Lyrical hallmark, and we believe it sets us up for another year of outperformance in 2022.
THE REBOUND CONTINUED
Value stocks, including Lyrical’s portfolio, entered a downcycle of underperformance in 2018 that reached its trough in the COVID panic, ending in March 2020. From the COVID panic bottom on March 18 through year-end 2020, value stocks rebounded sharply, vastly outperforming the S&P 500. In 2021, value stocks continued to outperform.
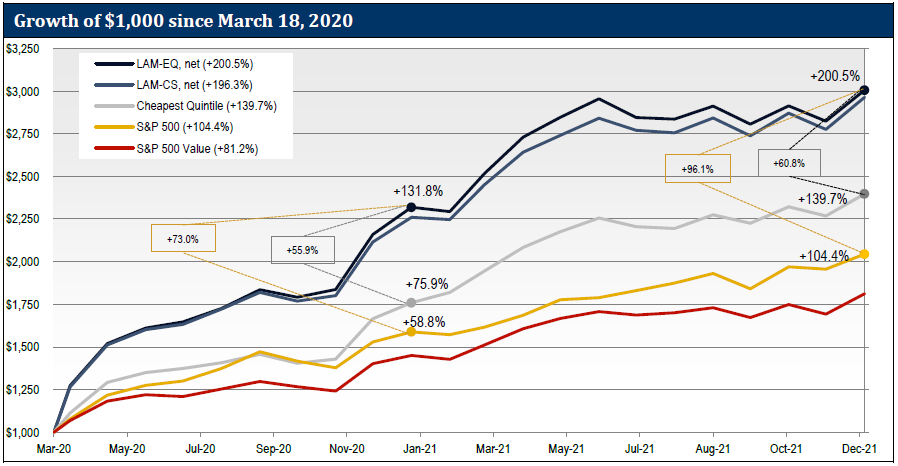
When we mention “value stocks” we are referring to the stocks with the lowest forward P/E ratios in our universe of the top 1,000 U.S. stocks. The line graph below shows the returns of the cheapest quintile, along with the returns of Lyrical’s composites, the S&P 500 and the S&P 500 Value.
Source: FactSet
After bottoming on March 18, 2020, the cheapest quintile rose rapidly, returning 75.9% by the end of 2020. The S&P 500 also rebounded, but gained only 58.8%, 17.1 percentage points less.
Lyrical’s portfolio rebounded even more than the cheapest stocks. Our EQ composite returned 131.8% off the March 18 bottom through the end of 2020. That is 55.9 percentage points more than the cheapest quintile and 73.0 percentage points more than the S&P 500.
With strong returns in 2021, these outperformance margins expanded further. The cheapest quintile has now returned 139.7% off the bottom compared to 104.4% for the S&P 500. Thus, the margin of outperformance has expanded from 17.1 to 35.3 percentage points.
Lyrical’s EQ composite has now returned 200.5% off the bottom through the end of 2021. That is 60.8 percentage points more than the cheapest quintile, 4.9 percentage points more outperformance than at the end of 2020. Compared to the S&P 500, the EQ composite is 96.1 percentage points ahead, an expansion of 23.1 percentage points.
RETURN OF THE VALUE FACTOR
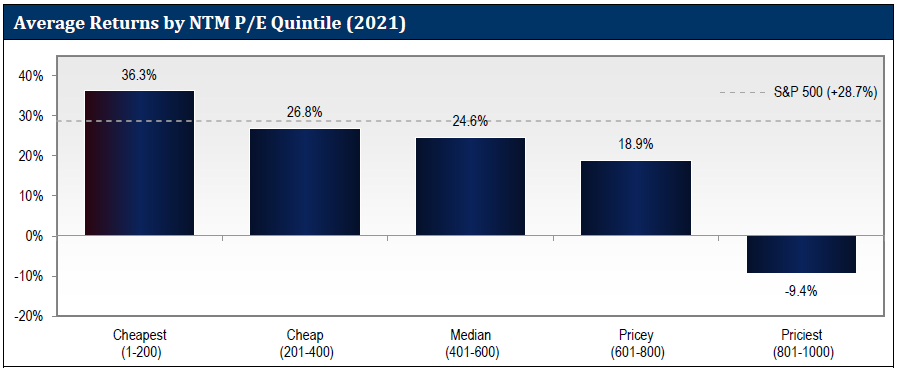
In 2021 the value factor once again returned to its historical norm, meaning a strong correlation between returns and valuation metrics. In the table below, we show the 2021 returns of our universe of the top 1,000 U.S. stocks sorted by forward P/E into five quintiles. The cheapest stocks with the lowest P/Es had the highest returns, and as each quintile got pricier with higher P/Es, the returns got lower.
This is a change from what we observed when value stocks first started to outperform in March 2020. Since that bottom, value stocks were succeeding without growth stocks failing. From March 18, 2020, through year-end 2020, the cheapest stocks did significantly outperform, returning 75.9% compared to 58.8% for the S&P 500. However, the priciest stocks also outperformed. The second most expensive quintile returned 77.6%, slightly more than the cheapest quintile, and the priciest quintile was the best performer of all, returning an amazing 118.3%.
Then, in 2021, the cheapest stocks continued outperforming but expensive stocks reverted to their historical pattern of underperforming. The second most expensive quintile trailed the S&P 500 by almost 10 percentage points, and the priciest quintile was a disaster, losing 9.4% and trailing the S&P 500 by over 38 percentage points!
Source: FactSet
The dismal performance of the priciest quintile may be a harbinger of broader growth stock underperformance in 2022. Roughly half of the priciest quintile is populated with money losing companies. In past bubbles, these most speculative stocks have been the first to fall, even as profitable expensive stocks continued to rise. Eventually, though, when past bubbles have burst, even the high-quality expensive stocks have seen their valuations correct, resulting in painful losses.
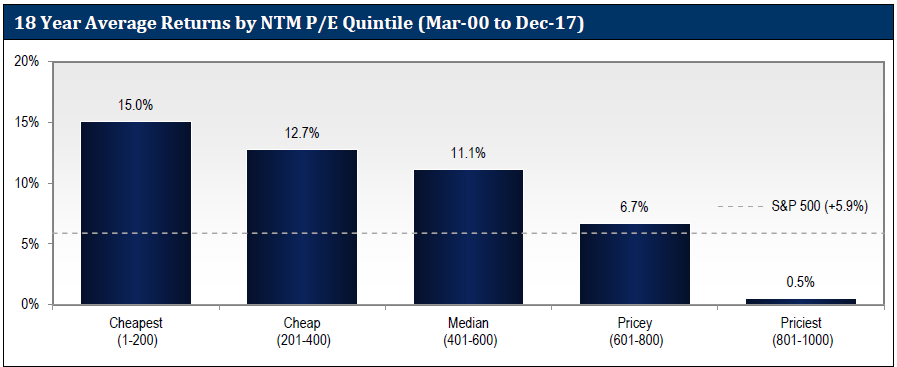
Growth stocks have been in favor for so long, investors might think there was something wrong with the market in 2021, with the priciest stocks realizing the worst returns. To us, there is nothing unusual about this trend, as the outperformance of expensive stocks is historically rare, only occurring in periods like 2018-2020 and the tech bubble of 1998-1999. For most of history, the norm has been higher returns for lower P/Es and lower returns for higher P/Es.
Look below at the 18-year track record of value from the end of the tech bubble in 2000 to the onset of the recent value downcycle after 2017. The cheapest stocks were the best performers, and the priciest stocks the worst, by a massive margin. We expect a similar environment to persist for several more years as value upcycles historically have lasted eight years on average.
Source: FactSet
VALUE STOCKS SUCCEEDED WHILE VALUE INDICES FAILED
Our warning in last year’s letter to “beware the value indices” proved prescient. As successful as value stock performance was in 2021, it was another disappointing year for value indices. The S&P 500 Value index returned 24.9% in 2021 trailing the S&P 500 by 380 bps. Other large-cap value indices, like the Russell 1000 Value and the MSCI USA Value, performed similarly. Furthermore, the S&P 500 Value trailed the 36.3% returns of the cheapest quintile by 11.4 percentage points.
Since March 18, 2020, value stocks have been outperforming while the large-cap value indices continue to underperform, and it is not just this current period. If we go back to 2009, the cheapest P/E quintile had a great nine-year run of performance through 2017. That quintile produced an annualized return of 19.4%, 410 bps per annum better than the S&P 500. For all the success value stocks had, the S&P 500 Value index underperformed with an annualized return of 13.7%, 160 bps per annum worse than the S&P 500.
This historical pattern holds going all the way back to 1979 when S&P launched its value index. Over 43 years the S&P’s value index has underperformed the broader S&P 500 by 90 bps per annum. The cheapest quintile did well during this period, outperforming the S&P 500 by 370 bps, but the value indices from S&P and others did not capture those returns. Value investing worked wonderfully over this timeframe, just not as implemented through those value indices.
Lyrical’s actively managed, concentrated portfolio is one way to access the benefits of value investing without the flaws of the major value indices. During 2021, we created another way with the launch of our U.S. Value ETF (USVT), which is passively managed to track the performance of the cheapest quintile. We believe our active approach is the best approach to value investing, and historically it has outperformed the cheapest quintile by over 200bp per annum. That said, some investors prefer a passive approach, and USVT should be a superior alternative to the passive funds tracking the major value indices.
RETURN OF INFLATION
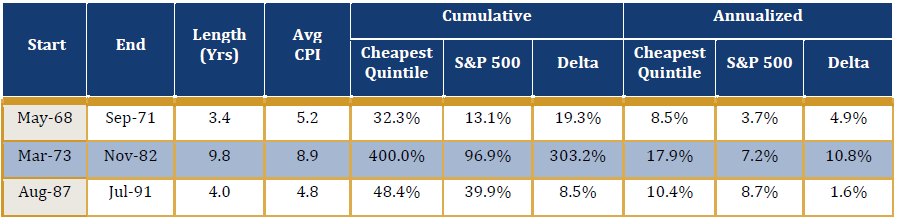
Until 2021, it had been almost 40 years since we last saw a period of high inflation. The Federal Reserve has a 2% target for inflation, as measured by the Consumer Price Index (CPI). In April, the CPI rose above 4% and has remained above 4% for the last nine months, with the last reading of 7% in December. Since it has been so long since inflation was a factor, we examined historical data to analyze the performance of value stocks during periods of inflation. Since 1960, there have been three distinct periods of elevated inflation. As shown on the table below, in each of those periods, value stocks (defined as the cheapest quintile) outperformed the S&P 500.
Source: FactSet
The highlighted row in the table above covers “The Great Inflation” period, which is the most extreme case in the last 40 years, when CPI averaged 9% for a decade. During that decade, the cheapest stocks in the market generated outperformance of 10.8% per annum, as shown on the graph below.
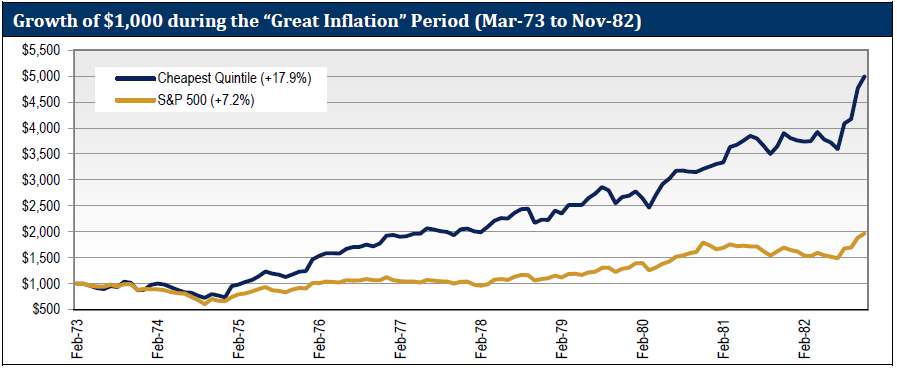
Source: FactSet
While value stocks in general have a history of outperformance in inflationary times, it is the quality of our companies that gives us confidence in this current inflation environment. We have seen the impact of nine months of inflation so far, and on average, our companies have been able to mitigate or benefit from the inflationary effects. Since April 2021, our portfolio’s consensus 2021 EPS estimate has been revised up 18% compared to 15% for the S&P 500. That bottom-up perspective along with the historical data lead us to believe inflation should be a positive factor for our returns.
LOOKING FORWARD
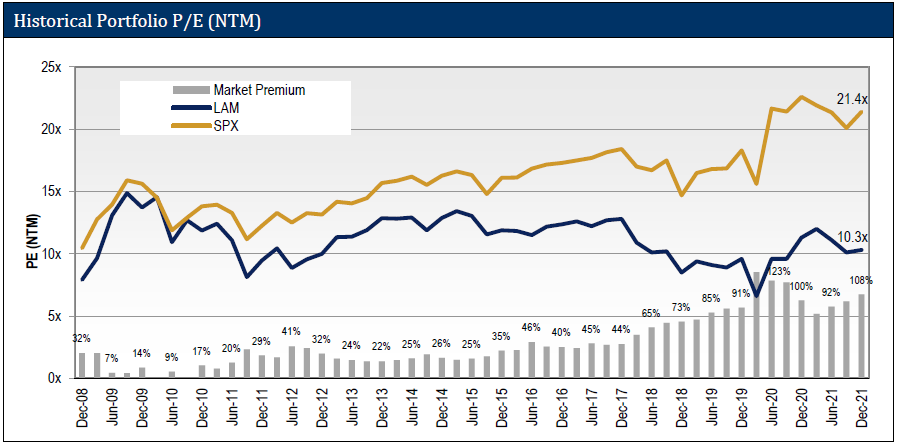
Although we generated a ~30% return for the year, due to strong earnings growth and some portfolio substitutions our portfolio’s forward P/E ratios declined a full point to 10.3x at year-end from 11.3x at the start of the year. The S&P 500 was up almost 29%, but its earnings grew more too, so its P/E also declined from 22.6x to 21.4x.
Even though both our and the S&P 500’s forward P/E fell by about a point, on a percentage basis our decline was greater. One point off 11.3x is a 9% decline. The S&P 500 P/E declined 1.2 points, but off the starting P/E of 22.6x it is only a 5% decline. The bigger percentage drop in our P/E ratio results in the further expansion of the valuation spread between our portfolio and the S&P 500, which increased from a very wide 100% at the start of the year to an even wider 108% at year end. Thus, the absolute and relative valuations have both become even more attractive.
Source: FactSet
Putting this very wide valuation spread into context, note that from 2009 to 2017, the first nine years of our firm, Lyrical outperformed the S&P 500 on a cumulative basis by 185 percentage points, net of fees. We started that period of outperformance at a valuation spread of 32%. Now the spread is 76 percentage points wider at 108%, reflecting the potential to deliver significantly more outperformance than we did over that nine-year period.
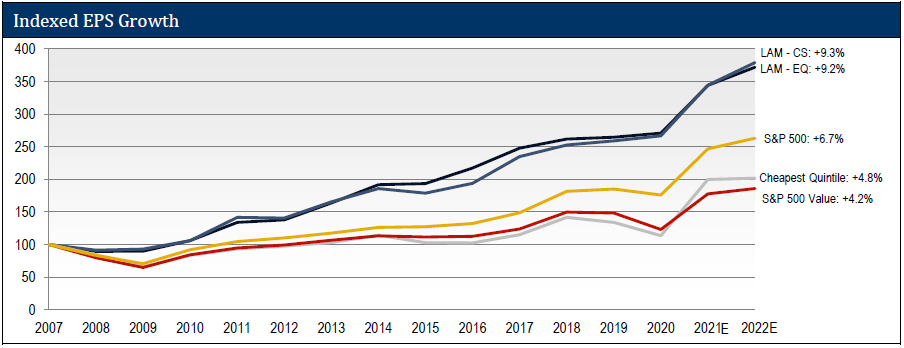
Our confidence is bolstered by the fundamentals of our portfolio. Throughout our firm history our portfolios have had a discounted P/E to the S&P 500 with comparable growth. Today, we do not just have comparable growth, but superior growth. In fact, over the last year our portfolio has had the best growth profile in our firm history.
As shown below, the historical growth of our current portfolio is over 9% per annum going back to 2007. That is faster than the 6.7% of the S&P 500, and much faster than the 4.2% growth of the S&P 500 Value. Not only have Lyrical’s portfolios grown faster, but they have done so with less economic sensitivity. Our portfolio earnings declined less during the COVID shutdowns of 2020 and during the Global Financial Crisis of 2008-09.
Source: FactSet
CONCLUSION
2021 was a great year of performance for Lyrical’s U.S. portfolios, with net returns over 30%, outperforming the S&P 500 by a little and the S&P 500 Value by a lot.
Based on the returns of the cheapest P/E quintile of stocks in our universe, 2021 was a continuation of the value upcycle we saw begin off the bottom in March 2020. This puts us about two years into a cycle that historically has lasted 6-12 years. Given that historical precedent and given the extremely wide valuation spread we see today, we believe we have several more years of significant value outperformance ahead of us. And, while we are bottom-up investors, focused more on company fundamentals than macro events, the current macro backdrop of increasing inflation could potentially be another tailwind for us based on how it has influenced value stock performance historically.
All that makes us feel good about our portfolio, but what makes us feel great are the fundamentals of the companies we own. We enter 2022 with a forward P/E ratio in the 10s and the best growth profile in our 13-year firm history. Our companies have faced the challenges of COVID over the last two years. They have shown their resiliency to the shutdowns and their ability to thrive in the reopening.
The future is always full of surprises, but we think we are in a fantastic position as we enter 2022.
THIS IS NOT AN OFFERING OR THE SOLICITATION OF AN OFFER TO INVEST IN THE STRATEGY PRESENTED. ANY SUCH OFFERING CAN ONLY BE MADE FOLLOWING A ONE-ON-ONE PRESENTATION, AND ONLY TO QUALIFIED INVESTORS IN THOSE JURISDICTIONS WHERE PERMITTED BY LAW.
THERE IS NO GUARANTEE THAT THE INVESTMENT OBJECTIVE OF THE STRATEGY WILL BE ACHIEVED. RISKS OF AN INVESTMENT IN THIS STRATEGY INCLUDE, BUT ARE NOT LIMITED TO, THE RISKS OF INVESTING IN EQUITY SECURITIES GENERALLY, AND IN A VALUE INVESTING APPROACH, MORE SPECIFICALLY. MOREOVER, PAST PERFORMANCE SHOULD NOT BE CONSTRUED AS AN INDICATOR OF FUTURE PERFORMANCE.
THE S&P 500 INDEX IS A MARKET CAPITALIZATION WEIGHTED INDEX COMPRISED OF 500 WIDELY-HELD COMMON STOCKS.
THE RUSSELL 1000 VALUE INDEX MEASURES THE PERFORMANCE OF THE LARGE-CAP VALUE SEGMENT OF THE U.S. EQUITY UNIVERSE. IT INCLUDES THOSE RUSSELL 1000 COMPANIES WITH LOWER PRICE-TO-BOOK RATIOS AND LOWER EXPECTED GROWTH VALUES. THE RUSSELL 1000 VALUE INDEX IS CONSTRUCTED TO PROVIDE A COMPREHENSIVE AND UNBIASED BAROMETER FOR THE LARGE-CAP VALUE SEGMENT. THE INDEX IS COMPLETELY RECONSTITUTED ANNUALLY TO ENSURE NEW AND GROWING EQUITIES ARE INCLUDED AND THAT THE REPRESENTED COMPANIES CONTINUE TO REFLECT VALUE CHARACTERISTICS.
ADDITIONAL INFORMATION REGARDING LAM –U.S. VALUE EQUITY-CS:
PERFORMANCE FIGURES PRIOR TO AUGUST 2013 REFLECT THE MODEL, HYPOTHETICAL RESULTS FOR A HYPOTHETICAL PORTFOLIO PURSUING THE MARKET CAPITALIZATION WEIGHTED INVESTMENT GUIDELINES (THE “GUIDELINES”) DESCRIBED BELOW, AND DO NOT REPRESENT RETURNS OF ACTUAL INVESTMENTS MADE. THERE ARE A VARIETY OF LIMITATIONS INHERENT IN MODEL RESULTS. TRANSACTION EXPENSES HAVE BEEN INCLUDED AT FIVE CENTS PER SHARE, TO REFLECT COMMISSIONS AND EXPECTED MARKET IMPACT. DIVIDENDS HAVE BEEN INCLUDED IN THE RETURNS. LAM’S CLIENTS HAD RESULTS THAT WERE MATERIALLY DIFFERENT FROM THOSE PORTRAYED IN THE MODEL.
MARKET CAPITALIZATION WEIGHTED INVESTMENT GUIDELINES
LAM’S ORIGINAL, U.S. VALUE EQUITY – EQ IS AN APPROXIMATELY 34 STOCK PORTFOLIO THAT IS EQUAL WEIGHTED AT COST TO TARGET 99% INVESTED WITH 1% CASH, HENCE APPROXIMATELY 3% PER POSITION. WE HAVE PICKED A BENCHMARK CAPITALIZATION LEVEL (THE “CAPITALIZATION BENCHMARK”) EQUAL TO $11.2BN AS OF DECEMBER 31, 2013 AND EQUAL TO $11.2BN MULTIPLIED BY THE QUOTIENT DERIVED BY DIVIDING THE LEVEL OF THE S&P 500 INDEX® AT ALL OTHER TIMES BY 1,848.36 (THE CLOSING PRICE OF THAT INDEX ON DECEMBER 31, 2013).
TO REFLECT A PORTFOLIO THAT HAS GREATER LIQUIDITY, WE CREATED A MODEL PORTFOLIO WITH MODIFIED PORTFOLIO POSITION WEIGHTS.
- STOCKS WITH A MARKET CAPITALIZATION GREATER THAN THE CAPITALIZATION BENCHMARK HAVE BEEN MADE EQUAL WEIGHTED FULL POSITIONS.
- STOCKS WITH A MARKET CAPITALIZATION LESS THAN THE CAPITALIZATION BENCHMARK HAVE HAD THEIR POSITION WEIGHTS SCALED IN PROPORTION TO THEIR MARKET CAP.
FOR EXAMPLE, A STOCK WITH A $5.6BN MARKET CAPITALIZATION AS OF DECEMBER 31, 2013 WOULD HAVE BEEN GIVEN AN INITIAL PORTFOLIO WEIGHT OF 0.5X A FULL POSITION. A STOCK WITH A $3.4BN MARKET CAPITALIZATION AS OF DECEMBER 31, 2013 WOULD HAVE BEEN GIVEN AN INITIAL PORTFOLIO WEIGHT OF 0.3X A FULL POSITION.
WITH LESS CAPITAL ALLOCATED TO THE LESS LIQUID STOCKS, WE HAVE GROSSED UP THE SIZE OF A FULL POSITION FROM THE CURRENT 2.9% IN THE EQUAL WEIGHTED ORIGINAL PORTFOLIO TO APPROXIMATELY 3.8% IN THE HYPOTHETICAL MARKET CAPITALIZATION WEIGHTED PORTFOLIO, TO ACHIEVE A MODEL PORTFOLIO WITH 99% INVESTED IN STOCKS AND 1% CASH.
PERFORMANCE ESTIMATION METHODOLOGY
TO ESTIMATE THE HISTORICAL PERFORMANCE OF THE U.S. VALUE EQUITY–CS, MARKET CAPITALIZATION WEIGHTED PORTFOLIO, WE APPLIED THE METHODOLOGY DESCRIBED ABOVE TO THE STOCKS IN OUR ORIGINAL U.S. VALUE EQUITY-EQ PORTFOLIO OF DECEMBER 31, 2008.
WE MODELED THAT ALL PURCHASES OF NEW HOLDINGS AND EXITS FROM EXISTING HOLDINGS THAT TOOK PLACE DURING A MONTH IN OUR ACTUAL PORTFOLIOS TOOK PLACE AS OF THE END OF THAT MONTH IN THE BACKTEST MODEL.
IN MONTHS WHERE CASH WAS NEEDED BECAUSE THE SIZE OF THE PURCHASED STOCK EXCEEDED THE PROCEEDS FROM THE STOCK SOLD, WE MODELED THAT WE TRIMMED THE LARGEST POSITION (AT MARKET) IN THE PORTFOLIO TO GENERATE ENOUGH CASH TO COVER THE DIFFERENCE.
IN MONTHS WHERE THE CASH POSITION ROSE TO LEVELS ABOVE 1% WE DID NOT REINVEST THE EXTRA CASH.
THESE MODEL RESULTS ARE UNAUDITED AND SUBJECT TO REVISION AND SHOW ALL PERIODS BEGINNING WITH THE FIRST FULL MONTH IN WHICH THE ADVISOR MANAGED ITS FIRST FEE-PAYING ACCOUNT. HYPOTHETICAL NET RETURNS INCLUDE A 1.25% BASE FEE.