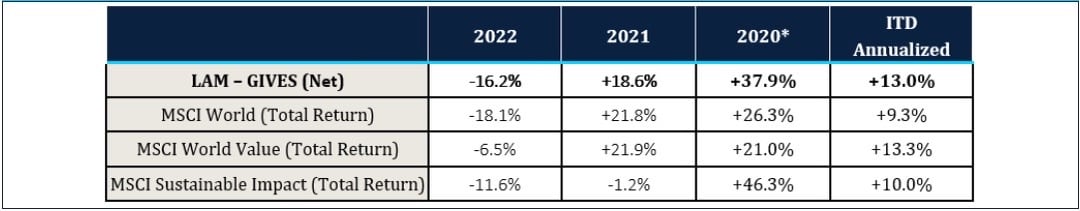
Our value impact strategy outperformed the MSCI World index by 190 bps in 2022. Since GIVES’ inception in 2020, we have generated a 13.0% annualized return, with 370 bps of outperformance, against the MSCI World Index. We have achieved this result while climbing a wall of worry that has included: COVID in 2020, an economic reopening in 2021, and then inflation, rising interest rates, the war in Ukraine, and a weakened European economy in 2022.
As we will highlight in this letter, it’s not easy to find impact businesses at cheap prices, but they do exist. Climate change can only be solved by a wide range of constituents working hard to reduce emissions. A select handful of these companies that play a major role in avoiding emissions are still trading at attractive valuations, are good quality businesses, and are analyzable. While we also address other impact themes in our portfolio, climate-related businesses make up most of our portfolio. For GIVES, as with Lyrical’s other strategies, valuation is the bedrock of the strategy. As expensive, popular stocks, including many that were promoted for their ESG marks, faltered in 2022, we avoided these names given our valuation criteria.
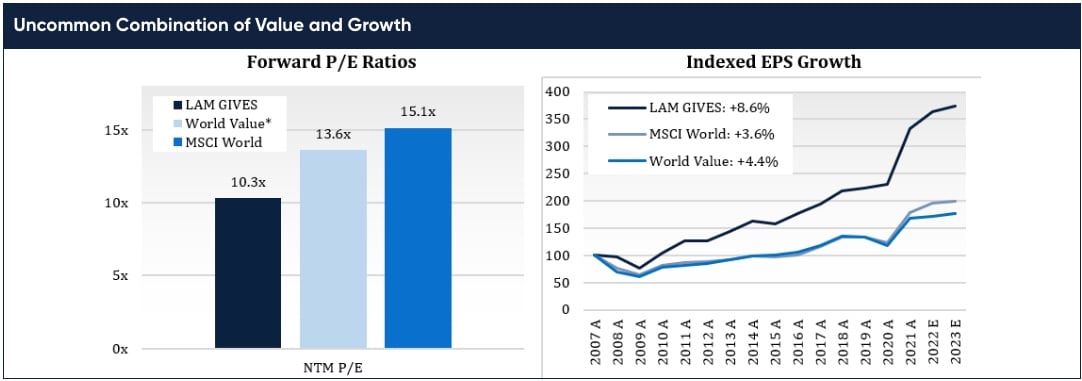
Looking forward, we have high expectations for both financial and environmental returns. From a valuation perspective, we continue to believe we are one of the only, if not the only, true value-focused impact funds. The portfolio is trading at 10.3x 12-month forward earnings, which is as cheap as it’s been since inception. From an earnings perspective, the portfolio shows superior fundamentals with better historical earnings growth and more resilient earnings during past economic downturns. From an environmental perspective, we see our companies helping avoid 13.2 million tCo2e through 2025, reducing water consumption by more than 10 billion liters, and aiding in the installation of nearly 1.2 gigawatts of solar capacity.
LOOKING BACK
As a value impact fund, we had both tailwinds and headwinds that affected performance in 2022. On the positive side, exposure to lower P/E stocks helped in 2022, as value (both through our lens of the cheapest quintile and the value indices) outperformed. On the negative side, lack of exposure to oil & gas and other commodities hurt, as these sectors posted strong results for the year. We estimate that our zero-exposure to energy and other non-energy commodities alone had a negative 2.1 percentage points impact on our performance, relative to the MSCI World Index.
SCREENING FOR IMPACT ISN'T EASY
One of the reasons we believe we are the only true deep value-focused impact fund is because it’s hard to do. To understand why, consider our process. As true value investors, our investment approach begins by hunting for stocks in the cheapest quintile of the market. Of our 2,500 stock universe, we typically remove 2,000 stocks based on valuation and focus on the cheapest 500. While this part of the market is fertile, having outperformed the MSCI World by 600 bps, annualized, since 1975, it’s littered with weak business models. As a result, we apply a Quality bar (focused on ROIC) and an Analyzability bar (focused on businesses we can understand and model). Our process is research-intensive and allows us to concentrate on approximately 70-80 stocks as potential investments.
How many of these candidates are impactful? That question leads to an entirely new round of bottom-up research since impact cannot be easily screened for. To illustrate why, let’s look at some of the common ways one might think about screening for value:
-
Industry Selection – According to the Global Industry Classification Standard (GICS), there are 158 sub-industries. Of these, there are only two clearly obvious categories to look for impact: Renewable Electricity and Environmental Services. And, in those sub-industries, there are just 22 stocks, which trade at an average of 28x next 12-month forward EPS.
-
ESG Scores – Put simply, ESG scores are inconsistent and, in our view, less helpful in identifying impactful businesses. Take the scores from Refinitiv—a major ESG-rating provider— for example. We sorted our 2,500 stock universe by Refinitiv ESG score, from best to worst: #1 is a bank in France, #6 is a tobacco company in the UK, and #14 is one of the largest oil and gas producers in the world.
-
Other Sustainability Metrics – Refinitiv also provides a “Renewable/Clean Energy Products Score,” but that’s not any more helpful. Two of the top five companies are commercial printing companies. And 9 of the top 17 are in the oil and gas servicing business, none of which are clearly or predominantly tied to renewable energy.
If it’s not easy to screen for impact, what do you do? Our belief is that this work needs to be done bottom-up, at the company level. This is especially true for impact measurement, which is less standardized and therefore more complex than traditional financial performance measurement. To identify and measure impact, our work usually involves multiple conversations with company executives and industry experts, as well as exhaustive proprietary research on industry and company data. The result is that from our global universe, we can typically identify about 1% that qualify using our framework of Value, Quality, and Analyzability + Impact ( VQA+I).
This process might sound arduous, because it is. The result, however, is something of which we are proud. In addition to the societal return for which we are investing, we also expect these companies will deliver strong financial returns for our investors.
EMISSION REDUCERS COME IN MANY FORMS
Most of the value impact opportunities that we currently find are tied to tackling climate change and reducing emissions. As the world transitions to cleaner energy, it is going to take a massive worldwide investment that will benefit a wide range of industries. And, through our process, we’re able to uncover several stocks that still trade at deep value prices.
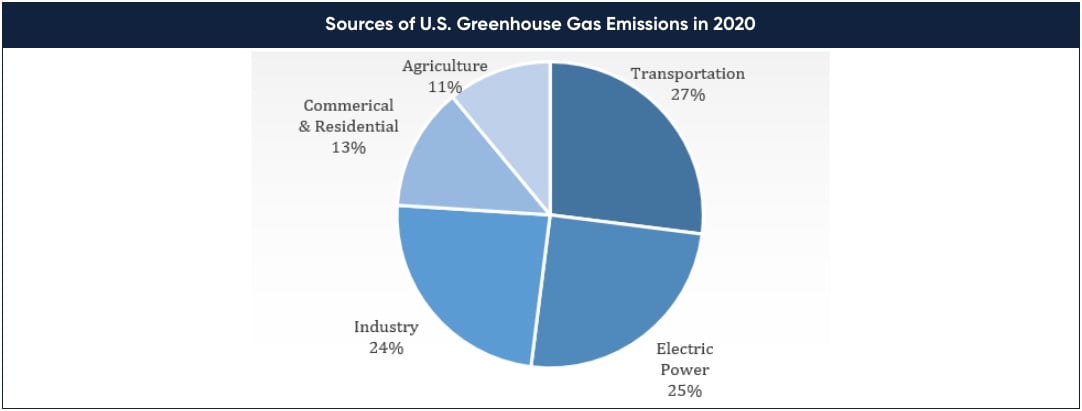
To get a better understanding of why these opportunities exist, let’s look at where emissions are generated and what will be needed to reduce them. There is no simple strategy for reducing carbon emissions. As you can see in the chart below, about half of U.S. emissions come from two main sources: transportation and electric power generation. The rest of emissions come from disparate areas, including industrial (itself widely diversified), commercial, and residential activities.
Since it has been such a long time since inflation was a factor, we examined historical data to analyze the performance of value stocks during periods of inflation. Since 1960, there have been three distinct periods of elevated inflation in the US. As shown on the table below, in each of those periods value stocks (defined as the cheapest quintile) outperformed the S&P 500.
The highlighted row in the table below covers “The Great Inflation” period in the US. This is the most extreme case of inflation in the last 40 years when CPI averaged 9% for a decade. During that decade, the cheapest stocks in the market generated outperformance of 10.8% per annum, as shown on the graph below.
We anticipate strong returns on an absolute and relative basis going forward. The MSCI World Index trades at about a 50% premium to our portfolio, which is similar to our estimate of upside to intrinsic value.
The key to our strategy is discipline. We focus on the cheapest corner of the market, looking for high-quality businesses that also generate societal good. By focusing on more hidden impact investment candidates, we believe we can deliver above-market value returns alongside clear impact.
We’ve done well so far and we’re eager to continue harvesting the gains from the seeds we’ve planted. We thank you for your confidence, and, as always, we welcome time to share ideas.