Original broadcast details
Date: Thursday, April 11, 2024
Executive Summary
The story of 1Q24 was mostly a continuation of the trends from 2023.
The S&P 500 followed its 26.3% return in 2023 with an additional 10.6% return in 1Q24, the best start to a year since 2019. Also like in 2023, in 1Q24 the S&P 500 return benefited from outsized contributions from a few mega-cap growth stocks.
Our LAM-CS composite outperformed the S&P 500 by +110 bps and the S&P 500 Value by +360 bps.
We outperformed despite not owning any of the mega-cap growth stocks that made outsized contributions to the S&P 500.
International markets also benefited from outsized gains in the largest stocks.
Our International and Global portfolios underperformed their cap-weighted benchmarks due to our underweight of the largest stocks, but they outperformed the equal-weighted versions of those benchmarks.
GIVES’ differentiated approach to value-style impact investing returned 9.3% as the MSCI ACWI Sustainable Impact Index lost 3.2%.
Many richly priced, impact-themed stocks suffered serious declines. We avoided these, given our valuation discipline. Price matters, even in impact investing.
Our portfolios remain attractively valued, even after strong returns.
In the U.S., even after our significant gains in 2023 and 1Q24, our LAM-CS forward P/E ended the quarter at 11.7x, only about half a point above its average since inception. Meanwhile, the S&P 500 forward P/E was 21.2x, 36% above its average over that same period.
The spread between our valuation and that of the S&P 500 remains extremely wide.
The valuation spread of our LAM-CS Composite relative to the S&P 500 was 81% at quarter-end. We continue to expect that this spread will compress and drive substantial outperformance. Based on earnings growth, it appears our portfolio should be valued at a premium to the S&P 500, not a discount.
We have been waiting a few years for the valuation spread to compress.
It can be hard to be patient, but outperforming by a little has been a pretty good way to pass the time, while we wait to outperform by a lot. Perhaps the waiting may be over, given our 39.7% return and 980 bps of outperformance over the last 12 months.
Please complete the form below to access the replay:
Past performance is not necessarily indicative of future results.
Please see the more complete performance information, and the footnotes and disclaimers set forth in the replay. As well, please see www.lyricalam.com/notes for a discussion of material risks of an investment.
Summary Performance Data:
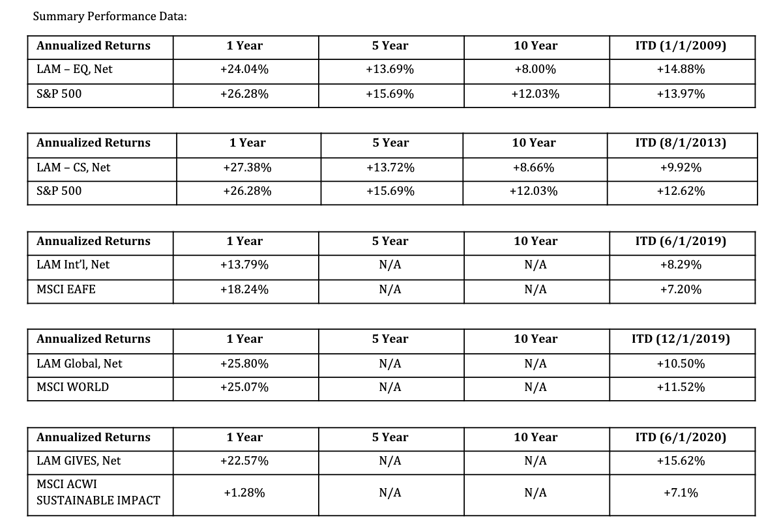
ALL DATA IS AS OF MARCH 31, 2024. THIS DOCUMENT IS CONFIDENTIAL AND INTENDED SOLELY FOR THE RECIPIENT. IT MAY NOT BE REPRODUCED OR REDISTRIBUTED WITHOUT THE PRIOR WRITTEN CONSENT OF LYRICAL ASSET MANAGEMENT (LAM).
THIS IS NOT AN OFFERING OR THE SOLICITATION OF AN OFFER TO INVEST IN THE STRATEGY PRESENTED. ANY SUCH OFFERING CAN ONLY BE MADE FOLLOWING A ONE-ON-ONE PRESENTATION, AND ONLY TO QUALIFIED INVESTORS IN THOSE JURISDICTIONS WHERE PERMITTED BY LAW.
THERE IS NO GUARANTEE THAT THE INVESTMENT OBJECTIVES OF OUR STRATEGIES WILL BE ACHIEVED. RISKS OF AN INVESTMENT INCLUDE, BUT ARE NOT LIMITED TO, THE RISKS OF INVESTING IN EQUITY SECURITIES GENERALLY, AND IN A VALUE INVESTING APPROACH, MORE SPECIFICALLY. MOREOVER, PAST PERFORMANCE SHOULD NOT BE CONSTRUED AS AN INDICATOR OF FUTURE PERFORMANCE. THE FOREGOING INFORMATION HAS NOT BEEN PROVIDED IN A FIDUCIARY CAPACITY, AND IT IS NOT INTENDED TO BE, AND SHOULD NOT BE CONSIDERED AS, IMPARTIAL INVESTMENT ADVICE.
INDEXES ARE PROVIDED FOR ILLUSTRATIVE PURPOSES ONLY, ARE UNMANAGED, REFLECT REINVESTMENT OF INCOME AND DIVIDENDS AND DO NOT REFLECT THE IMPACT OF ADVISORY FEES. INVESTORS CANNOT INVEST DIRECTLY IN AN INDEX. COMPARISONS TO INDEXES HAVE LIMITATIONS BECAUSE INDEXES HAVE VOLATILITY AND OTHER MATERIAL CHARACTERISTICS THAT DIFFER FROM THOSE OF LYRICAL’S STRATEGIES.
THE S&P 500 INDEX IS A MARKET CAPITALIZATION WEIGHTED INDEX COMPRISED OF 500 WIDELY-HELD COMMON STOCKS. THE S&P 500 VALUE INDEX MEASURES THE PERFORMANCE OF THE LARGE CAP VALUE SEGMENT OF THE U.S. EQUITY UNIVERSE. IT INCLUDES THOSE S &P 500 COMPANIES WITH LOWER PRICE TO BOOK RATIOS AND LOWER EXPECTED GROWTH VALUES.
THE MSCI EAFE INDEX IS DESIGNED TO REPRESENT THE PERFORMANCE OF LARGE AND MID-CAP SECURITIES ACROSS 21 DEVELOPED MARKETS, INCLUDING COUNTRIES IN EUROPE, AUSTRALASIA AND THE FAR EAST, EXCLUDING THE U.S. AND CANADA. THE INDEX IS AVAILABLE FOR A NUMBER OF REGIONS, MARKET SEGMENTS AND SIZES AND COVERS APPROXIMATELY 85% OF THE FREE FLOAT-ADJUSTED MARKET CAPITALIZATION IN EACH OF THE 21 COUNTRIES.
THE MSCI WORLD INDEX CAPTURES LARGE AND MID-CAP REPRESENTATION ACROSS 23 DEVELOPED MARKETS COUNTRIES. WITH 1,465 CONSTITUENTS, THE INDEX COVERS APPROXIMATELY 85% OF THE FREE FLOAT-ADJUSTED MARKET CAPITALIZATION IN EACH COUNTRY.
THE MSCI ACWI SUSTAINABLE IMPACT INDEX IS DESIGNED TO IDENTIFY LISTED COMPANIES WHOSE CORE BUSINESS ADDRESSES AT LEAST ONE OF THE WORLD’S SOCIAL AND ENVIRONMENTAL CHALLENGES, AS DEFINED BY THE UNITED NATIONS SUSTAINABLE DEVELOPMENT GOALS. THE SUSTAINABLE IMPACT CATEGORIES INCLUDE: NUTRITIOUS PRODUCTS, TREATMENT OF MAJOR DISEASES, SANITARY PRODUCTS, EDUCATION, AFFORDABLE HOUSING, LOANS TO SMALL AND MEDIUM SIZE ENTERPRISES, ALTERNATIVE ENERGY, ENERGY EFFICIENCY, GREEN BUILDING, SUSTAINABLE WATER, AND POLLUTION PREVENTION. TO BE ELIGIBLE FOR INCLUSION IN THE INDEX, COMPANIES MUST GENERATE AT LEAST 50% OF THEIR SALES FROM ONE OR MORE OF THE SUSTAINABLE IMPACT CATEGORIES AND MAINTAIN MINIMUM ENVIRONMENTAL, SOCIAL AND GOVERNANCE (ESG) STANDARDS. THE PARENT INDEX IS MSCI ACWI. CONSTITUENT SELECTION IS BASED ON DATA FROM MSCI ESG RESEARCH.