Original broadcast details
Date: Thursday, January 11, 2024
Executive Summary
2023 was the third year in a row our U.S. Value CS composite outperformed the S&P 500.
We started the year slowly and then experienced seven strong months to finish ahead of the S&P 500, despite not owning any of the Magnificent Seven mega-cap growth stocks.
The story of 2023 was the Magnificent Seven, which contributed 16.3 percentage points of the 26.3% S&P 500 return.
Excluding the Magnificent Seven, the rest of the S&P 500 had an average return of 13.5%. This is close to the 13.9% return of the S&P 500 Equal Weight index.
Our International portfolio had a strong 4Q but underperformed for the year.
This marks the first time since inception we underperformed both the EAFE and EAFE Value in a calendar year. Our underperformance was driven largely by multiple compression, not fundamentals.
Our portfolios remain attractively valued even after strong returns in 2023.
Our U.S. Value CS composite’s forward P/E at year end was 11.1x, slightly below the average since inception. Meanwhile, the S&P 500 year-end forward P/E was 19.7x, 26% above its average over the same period.
Our valuation spread relative to the S&P 500 remains extremely wide.
The valuation spread of our US portfolio relative to the S&P 500 was 86% at year-end, and >90% proforma after the recent sale of Broadcom. We continue to expect this spread eventually to revert to the pre-2018 average of ~30%, which we would expect to drive substantial outperformance. While we’ve been patiently waiting for this to happen, we are proud to have outperformed the S&P 500 in each of the last three years.
Please complete the form below to access the replay:
Past performance is not necessarily indicative of future results.
Please see the more complete performance information, and the footnotes and disclaimers set forth in the replay. As well, please see www.lyricalam.com/notes for a discussion of material risks of an investment.
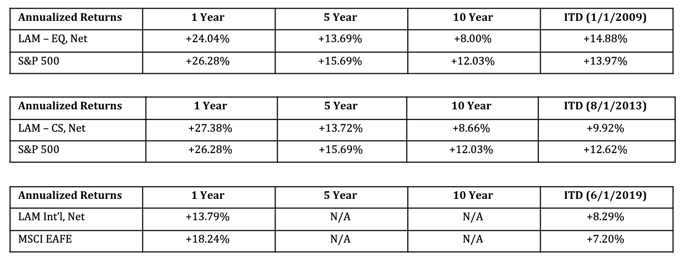
Summary Performance Data:
ALL DATA IS AS OF DECEMBER 31, 2023. THIS DOCUMENT IS CONFIDENTIAL AND INTENDED SOLELY FOR THE RECIPIENT. IT MAY NOT BE REPRODUCED OR REDISTRIBUTED WITHOUT THE PRIOR WRITTEN CONSENT OF LYRICAL ASSET MANAGEMENT (LAM).
THIS IS NOT AN OFFERING OR THE SOLICITATION OF AN OFFER TO INVEST IN THE STRATEGY PRESENTED. ANY SUCH OFFERING CAN ONLY BE MADE FOLLOWING A ONE-ON-ONE PRESENTATION, AND ONLY TO QUALIFIED INVESTORS IN THOSE JURISDICTIONS WHERE PERMITTED BY LAW.
THERE IS NO GUARANTEE THAT THE INVESTMENT OBJECTIVES OF OUR STRATEGIES WILL BE ACHIEVED. RISKS OF AN INVESTMENT INCLUDE, BUT ARE NOT LIMITED TO, THE RISKS OF INVESTING IN EQUITY SECURITIES GENERALLY, AND IN A VALUE INVESTING APPROACH, MORE SPECIFICALLY. THE FOREGOING INFORMATION HAS NOT BEEN PROVIDED IN A FIDUCIARY CAPACITY, AND IT IS NOT INTENDED TO BE, AND SHOULD NOT BE CONSIDERED AS, IMPARTIAL INVESTMENT ADVICE.
INDEXES ARE PROVIDED FOR ILLUSTRATIVE PURPOSES ONLY, ARE UNMANAGED, REFLECT REINVESTMENT OF INCOME AND DIVIDENDS AND DO NOT REFLECT THE IMPACT OF ADVISORY FEES. INVESTORS CANNOT INVEST DIRECTLY IN AN INDEX. COMPARISONS TO INDEXES HAVE LIMITATIONS BECAUSE INDEXES HAVE VOLATILITY AND OTHER MATERIAL CHARACTERISTICS THAT DIFFER FROM THOSE OF LYRICAL’S STRATEGIES.
THE S&P 500® IS WIDELY REGARDED AS THE BEST SINGLE GAUGE OF LARGE-CAP U.S. EQUITIES. THE INDEX THE INDEX INCLUDES 500 LEADING COMPANIES AND COVERS APPROXIMATELY 80% OF AVAILABLE MARKET CAPITALIZATION. THE S&P 500® VALUE DRAWS CONSTITUENTS FROM THE S&P 500®. S&P MEASURES VALUE USING THREE FACTORS: THE RATIO OF BOOK VALUE, EARNINGS, AND SALES TO PRICE. S&P STYLE INDICES DIVIDE THE COMPLETE MARKET CAPITALIZATION OF EACH PARENT INDEX INTO GROWTH AND VALUE SEGMENTS.
THE MSCI EAFE INDEX IS DESIGNED TO REPRESENT THE PERFORMANCE OF LARGE AND MID-CAP SECURITIES ACROSS 21 DEVELOPED MARKETS, INCLUDING COUNTRIES IN EUROPE, AUSTRALASIA AND THE FAR EAST, EXCLUDING THE U.S. AND CANADA. THE INDEX IS AVAILABLE FOR A NUMBER OF REGIONS, MARKET SEGMENTS AND SIZES AND COVERS APPROXIMATELY 85% OF THE FREE FLOAT-ADJUSTED MARKET CAPITALIZATION IN EACH OF THE 21 COUNTRIES.